Share it with your network.
The world of consumer packaged goods (CPG) is more competitive than ever, with the analytics market projected to hit $1.22 billion by 2025. With numerous brands competing for limited shelf space in physical retail stores, in-store execution has become increasingly essential.
Traditional manual checks and static reports often miss real-time shelf changes. This can create gaps that lead to stockouts, missed promotions, and lost sales opportunities.
This is where retail analytics dashboards come in. Unlike static reports, they provide a dynamic, real-time view of what’s happening on the shelf. By tracking metrics such as on-shelf availability, share of shelf, and planogram compliance, dashboards serve as the real-time decision-making engine that modern CPG execution needs.
At a Glance:
- Real-Time Visibility: Dashboards provide instant insights into product placement, planogram compliance, and promotional gaps, enabling quick corrective action.
- Actionable Insights: Key metrics like on-shelf availability and share of shelf guide informed, data-driven marketing and sales decisions.
- Role-Based Customization: Users get tailored views based on their role. A field sales rep might see which stores need restocking today, while category managers track underperforming SKUs by region. This ensures relevant insights for store, SKU, or promotion management.
- Enhanced Store Performance: Tracking critical KPIs supports consistent product visibility and optimized retail execution.
What are Retail Analytics Dashboards for CPG Brands?
A retail analytics dashboard is a centralized, real-time visualization tool that aggregates and displays key performance indicators (KPIs) related to in-store execution. CPG brands rely on dashboards to turn raw shelf data into actionable insights.
Here’s why they matter for CPG brands:
- Centralized Store Intelligence: Consolidates data from multiple stores into a single view, giving brands a complete picture of in-store performance.
- Real-Time Issue Detection: Instantly identifies misplaced SKUs or promotional gaps, reducing the time between problem detection and resolution.
- Data-Driven Prioritization: Helps CPG teams decide which stores or SKUs need immediate attention for maximum impact.
- Optimized Resource Allocation: Allows for better planning and allocation of field resources based on real-time data.
- Increased Sales Opportunities: By ensuring products are always available and correctly placed, dashboards contribute to maximizing sales potential.
- Competitive Advantage: Provides a deeper understanding of in-store dynamics, enabling CPG brands to stay ahead of competitors.
Key Features of an Effective Retail Analytics Dashboard
Not all dashboards are the same. For CPG execution, the dashboard must be built around features that make shelf data easy to access, interpret, and act upon. The right features ensure the dashboard isn’t just reporting, but enabling execution.
Here are the key features that make a dashboard valuable:
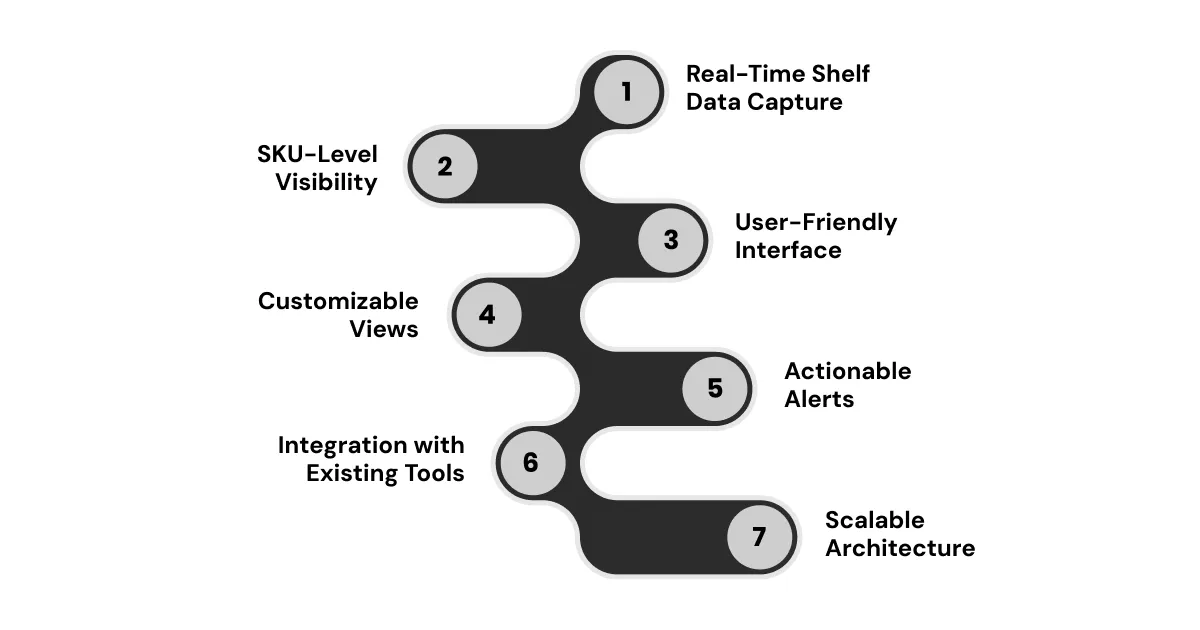
1. Real-Time Shelf Data Capture
The ability to capture shelf conditions in real time is crucial for CPG execution. Real-time data helps field teams spot stockouts, misplaced SKUs, or promotional gaps immediately. This reduces missed sales opportunities and ensures products are always available where they matter most.
2. SKU-Level Visibility
An effective dashboard tracks each product individually. SKU-level visibility lets brands monitor the presence, placement, and performance of every product on the shelf. This precision ensures top-selling and high-priority SKUs maintain visibility and follow the planogram consistently.
3. User-Friendly Interface
Complex data is only useful if it is easy to understand. A clean, simple interface encourages adoption across teams. Dashboards should present data clearly, allowing sales and marketing teams to grasp insights quickly. Visualizations like charts, graphs, and color-coded alerts make information easy to interpret and act on.
4. Customizable Views
Different roles need different insights. Sales leaders may focus on store-level and SKU-level performance, while trade marketing directors may track promotional compliance. A dashboard that allows customizable views ensures every user gets the information needed to take action.
5. Actionable Alerts and Notifications
Dashboards should not only display data but also highlight issues that require immediate attention. Alerts for low stock, planogram deviations, or missing promotions help teams act quickly instead of discovering problems too late.
6. Integration with Existing Tools
Dashboards work best when they complement a company’s existing systems, such as field force management or CRM platforms. Seamless integration ensures that insights are actionable and can be directly tied to retail execution strategies without manual data transfer or duplication.
7. Scalable Architecture
A dashboard must handle data from hundreds or thousands of stores without slowing down. Scalable architecture ensures that as a brand grows or launches new SKUs, the dashboard continues to deliver fast, accurate insights across all locations.
These features collectively ensure that dashboards are not just data displays but practical tools for improving in-store performance and consistent execution.
Key Metrics CPG Leaders Should Track Through Dashboards
Dashboards are only valuable if they highlight the right metrics. For CPG brands, focusing on the right KPIs tied directly to in-store execution helps teams respond quickly and maintain a strong shelf presence.
1. On-Shelf Stock Availability
On-shelf stock availability measures whether products are visible and accessible on the shelf. Tracking this metric allows CPG teams to detect stockouts early and take corrective actions. Consistently monitoring on-shelf availability reduces lost sales and maintains brand presence.
2. Share of Shelf
Share of shelf indicates the proportion of shelf space a brand occupies relative to competitors in the same category. It is a key indicator of visibility and influence within the store. A higher share often leads to more consumer attention and sales, making it vital for sales and trade marketing teams.
3. Planogram Compliance
Planogram compliance tracks whether products are placed according to the pre-defined layouts. Correct SKU placement ensures optimal visibility, easy customer navigation, and brand consistency.. Monitoring this metric helps identify deviations, lets field teams fix issues before they affect sales or perception.
4. Promotional Execution
Promotional execution measures whether promotional displays, discounts, and signage are implemented correctly in-store. By tracking this metric, CPG brands can ensure that marketing campaigns deliver their intended impact and promotions remain consistent across stores. It also helps compare performance across regions and adjust strategies as needed.
5. Stockout Frequency and Duration
Beyond knowing whether a product is out of stock, this metric measures how often and for how long stockouts occur. Monitoring stockout frequency and duration allows CPG brands to prioritize stores needing immediate action and prevent recurring gaps.
6. Compliance Gaps Across Regions
This metric combines planogram and promotional compliance data across regions or store clusters. It provides a bigger picture, helping leaders identify patterns, allocate resources efficiently, and maintain consistent execution across markets.
Types of Retail Analytics Dashboards for CPG Brands
Different dashboards serve different purposes depending on the role and the execution challenge. Understanding these types helps CPG brands access the right insights quickly and act effectively at the shelf.
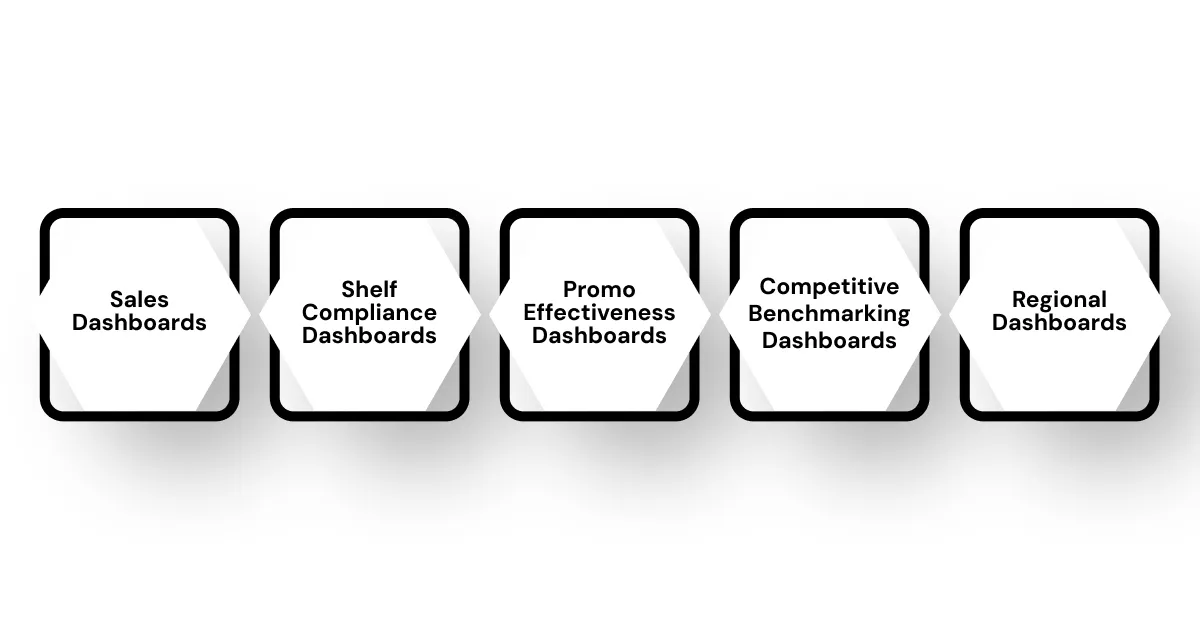
1. Sales Performance Dashboards
Sales performance dashboards offer a comprehensive view of how products are performing across different retail locations. They track metrics such as sales volume, revenue, and market share, allowing brands to identify top-performing products and underperforming SKUs. By analyzing these metrics, CPG brands can adjust their strategies to improve product placement and promotional efforts.
2. Shelf Compliance Dashboards
Shelf compliance dashboards focus on ensuring that products are displayed according to the agreed-upon planograms. They monitor factors like product facings, shelf space allocation, and product positioning. Maintaining planogram compliance helps brands maximize product visibility and availability, leading to increased sales and better in-store execution.
3. Promotional Effectiveness Dashboards
Promotional effectiveness dashboards assess the impact of in-store promotions on sales performance. They track metrics such as uplift in sales volume, redemption rates, and ROI for promotional activities. Analyzing these metrics helps CPG brands refine their promotional strategies to get the most out of each campaign.
4. Competitive Benchmarking Dashboards
Competitive benchmarking dashboards enable CPG brands to compare their performance against competitors. They provide insights into market share, pricing strategies, and promotional activities of rival brands. This data helps brands identify competitive advantages and areas for improvement, guiding strategic decisions.
5. Regional or Market Dashboards
Designed for managers and executives, these dashboards provide a broader view of retail performance across multiple markets or regions. They help identify trends, compare performance between regions, and allocate resources strategically to address gaps or replicate successes.
Each type focuses on specific challenges, making it easier for CPG brands to monitor and improve in-store performance efficiently.
How to Build a Retail Analytics Dashboard for CPG Brands?
Building a retail analytics dashboard for CPG execution involves careful planning and a focus on usability. The goal is to ensure that insights are actionable, easy to interpret, and relevant to the needs of each team. Here’s a step-by-step approach to building a dashboard that delivers value:
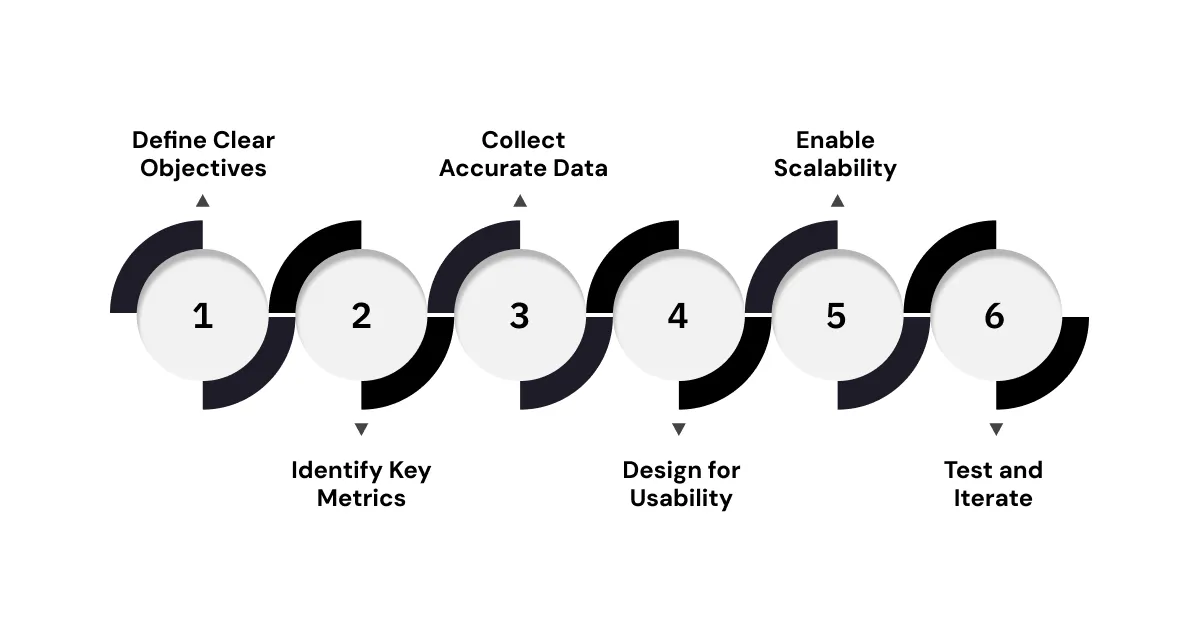
Step 1: Define Clear Objectives
Before building a dashboard, identify the main goals. Are you aiming to reduce out-of-stock issues, improve planogram compliance, or monitor promotional execution? Clear objectives help you pick the right metrics so that the dashboard actually works for your team.
Step 2: Identify Key Metrics
Once objectives are set, determine which KPIs matter most. For CPG execution, focus on metrics like on-shelf stock availability, share of shelf, planogram compliance, and promotional implementation. Tracking the right metrics ensures the dashboard highlights gaps your team can act on without overwhelming them with unnecessary data.
Step 3: Collect Accurate Data
Reliable dashboards depend on high-quality data. Use automated image recognition tools to capture real-time shelf conditions across stores. Accurate visual data lets your team act on what’s really happening in stores, reducing errors and improving decisions.
Step 4: Design for Usability
The dashboard should be intuitive and easy to navigate for all users, from field agents to trade marketing directors. Use simple visuals, clear layouts, and role-specific views so that users can quickly see the data and make decisions without long training.
Step 5: Enable Scalability
Your dashboard should handle growth, whether adding more SKUs, stores, or regions. It should connect smoothly with tools like CRM or field management platforms so that teams can act quickly on the data across markets.
Step 6: Test and Iterate
Once the dashboard is live, gather feedback from end users. Monitor usage, identify gaps, and update layouts or metrics as needed. Regular updates keep the dashboard useful as your business changes and provide maximum value.
Common Challenges in Implementing Retail Dashboards for CPG Brands
Even though dashboards can provide real-time shelf visibility, implementing them comes with hurdles. Knowing these challenges ahead helps you avoid failure.
- Data Accuracy concerns: Manual audits are slow and prone to errors. Without automated shelf data capture, dashboards may provide outdated or unreliable insights, undermining decision-making.
- Driving User Adoption: Field teams and sales representatives may be hesitant to use new tools. Dashboards succeed only when users see them as practical aids, not additional workload.
- Integration with Existing Systems: Dashboards must connect smoothly with existing CRM or ERP platforms to avoid duplicated effort and keep workflows simple.
- Cost and Scale: Large CPG brands operate across thousands of stores. Scaling dashboards to handle massive volumes of data without driving up costs can be challenging.
- Ensuring Data Security and Privacy: Protecting sensitive business data is necessary. Following data protection rules and adding strong security measures helps reduce the risks of data breaches.
Addressing these challenges requires not only technology but also a clear roadmap for training, integration, and continuous improvement.
Future of Retail Analytics Dashboards in CPG
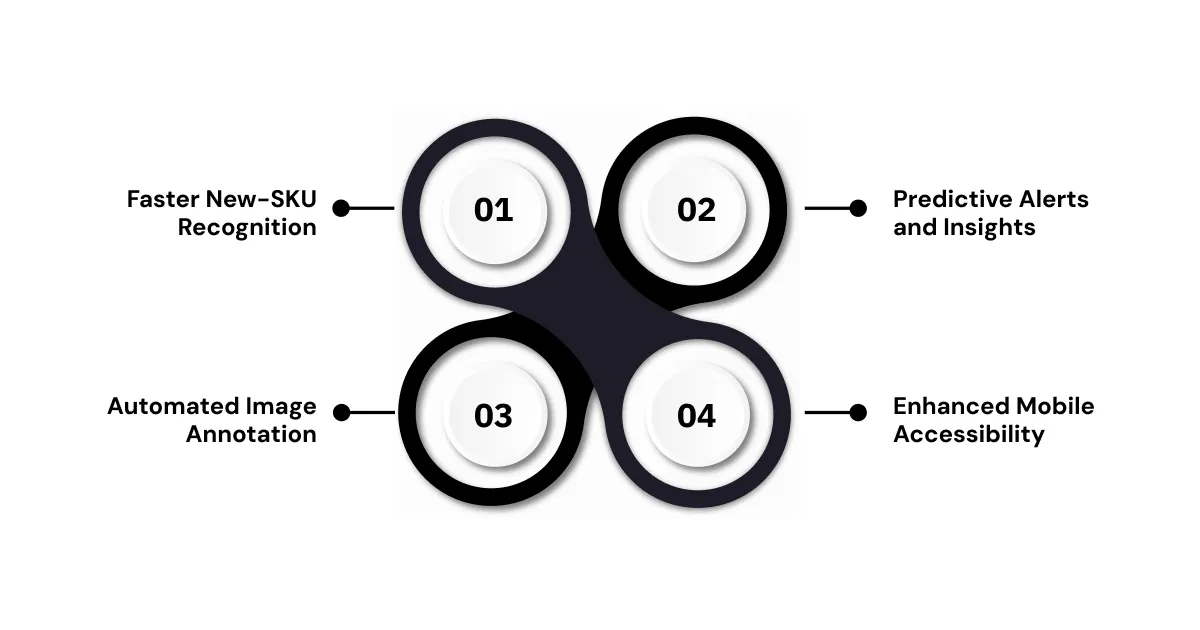
Retail analytics dashboards are evolving rapidly. New advancements will make dashboards smarter, faster, and more actionable, helping CPG brands keep shelves on track with minimal lag.
- Faster New-SKU Recognition: Dashboards will quickly recognize new products, ensuring that new SKUs are tracked accurately across all stores within days of launch.
- Predictive Alerts and Insights: Advanced dashboards will not only flag current issues but also anticipate gaps before they occur.
- Automated Image Annotation: AI-driven annotation will reduce manual effort in labeling shelf images, speeding up data processing while maintaining high accuracy.
- Enhanced Mobile Accessibility: Mobile-friendly dashboards let field teams access and act on insights directly from stores.
In the future, dashboards will not just display shelf conditions but actively guide execution decisions in near real-time.
How ParallelDots Empowers Smarter CPG Execution with Analytics Dashboards?
ParallelDots helps CPG brands transform in-store execution by turning visual shelf data into actionable insights. With advanced AI-powered solutions, brands gain real-time visibility across all stores, enabling faster, data-driven decisions.
Here’s how we can assist you:
1. On-Shelf Stock Tracking: ShelfWatch captures detailed shelf images and converts them into precise data on SKU availability. Sales teams can quickly identify stockouts or low inventory levels, ensuring that every product is consistently available for shoppers. This visibility minimizes missed sales opportunities and helps maintain brand presence across stores.
2. Real-Time Planogram Compliance: With automated monitoring of product placement, dashboards indicate whether SKUs are positioned according to approved planograms. Deviations are highlighted instantly, allowing category managers and field teams to correct errors on the spot, ensuring consistent product presentation across all locations.
3. Share of Shelf Insights: ShelfWatch calculates the share of shelf for each SKU and brand, enabling CPG leaders to assess visibility against competitors. This metric supports strategic decisions regarding shelf space allocation, product prioritization, and overall category management, enabling the maintenance of a competitive advantage.
4. Promotion and Pricing Verification: Trade marketing teams can monitor promotions and campaigns directly through the dashboards. ShelfWatch tracks whether displays, pricing, and special offers are implemented accurately, helping ensure marketing investments achieve intended results.
5. Rapid SKU Adaptation with Saarthi: The integrated Saarthi tool accelerates AI model training, allowing new or unknown SKUs to be recognized within 48 hours. This rapid adaptation ensures that dashboards remain up-to-date as product portfolios expand, reducing delays in execution tracking.
By combining these capabilities, ParallelDots transforms store visits into data-driven execution opportunities, giving CPG brands the confidence to act quickly and maintain a perfect store standard.
Request a demo today to see how ParallelDots can transform your in-store execution and drive brand success.
Frequently Asked Questions
1. What does a good retail dashboard look like?
A good retail dashboard is intuitive, visually clear, and real-time, offering at-a-glance insights into sales and stock performance. It uses charts, KPIs, and alerts to highlight performance gaps, enabling quick decision-making. Customizable layouts allow users to focus on metrics relevant to their role and business goals.
2. What role do retail analytics dashboards play in monitoring price compliance?
Retail dashboards track price adherence across stores and channels, flagging discrepancies in real-time. By comparing actual vs. intended pricing, they ensure promotions and discounts are applied correctly. Visual alerts and trend analyses help managers enforce pricing strategies consistently, reducing revenue loss and enhancing customer trust.
3. What data sources typically feed into a retail analytics dashboard?
Retail dashboards pull data from POS systems, ERP software, and customer loyalty programs. External sources like market trends, competitor pricing, and social sentiment can also be integrated. This consolidated data provides a comprehensive view of sales, stock, and performance metrics.
4. How secure and customizable are CPG retail analytics dashboards?
Modern CPG dashboards offer robust security, including role-based access, encryption, and compliance with data protection standards. They are highly customizable, allowing users to select KPIs, layout, and visualization types. Businesses can tailor dashboards to specific teams, regions, or product lines, ensuring relevant insights are delivered securely and effectively.
.png)
.png)
.png)