Share it with your network.


Computer vision retail ROI is the financial return a CPG brand gets from deploying shelf-monitoring image recognition, measured as recovered sales, labour savings, and recovered trade spend, minus the total cost of deployment. For most single-use-case rollouts, it becomes positive within 3 to 12 months, depending on which shelf problem is being solved first.
Table of Contents
- Where the Money Leaks Today
- What Computer Vision Recovers
- The Retail AI Investment ROI Math
- How This Looks by Stakeholder
- A Worked Example: Computer Vision Retail ROI in Practice
- What the Payback Timeline Looks Like
- Frequently Asked Questions
Key Takeaways
- Retail AI investment ROI comes down to a simple equation: recovered sales plus labour savings plus recovered trade spend, minus deployment cost – not a vague promise of “better visibility".
- The four biggest hidden costs of running shelf operations without image recognition are manual audit labour, phantom stockouts, planogram drift, and unverified trade spend.
- Computer vision doesn’t eliminate these costs outright – it shortens the time between when a shelf problem happens and when someone can act on it, which is where the recovered revenue actually comes from.
- Payback timelines differ by use case: stockout detection typically breaks even fastest, trade spend verification next, and planogram compliance last.
- A CFO evaluating this investment needs the full deployment cost, not just the software line item, weighed against a specific, defensible recovered-value number.
A brand manager builds an internal case for ShelfWatch, presents the results from a pilot, and gets one question back from the CFO: what’s the return on this?
It’s a reasonable question, and most retail AI pitches aren’t built to answer it. They describe what the platform does – flags stockouts, tracks planogram compliance, and verifies trade spend – without translating any of it into a number a finance team can evaluate against other capital requests. “Improves visibility” doesn’t clear a budget review. A specific return, over a specific timeframe, against a specific cost, does.
This is where most retail AI investment cases stall: not on whether the technology works but on whether anyone has done the math. The rest of this post does that maths – where the money leaks today without image recognition, what a shelf-monitoring platform actually recovers, the formula for calculating computer vision retail ROI, a worked example, and a realistic payback timeline.
Where the Money Leaks Today
Most CPG brands are running shelf operations on an information cycle that was built for a slower retail environment: quarterly resets, monthly field visits, and compliance reconciled by hand weeks after the fact. That cycle has four specific points where revenue and trade investment quietly disappear.
Manual audit labor
Field teams still cover their store lists on a fixed rotation, logging shelf conditions store by store, often on a three-to-four-week cycle for a mid-sized regional account list. The labour cost itself is budgeted and visible. What’s not visible is the cost of the gap between visits – a rep who catches an issue on day one of the cycle has no way to know what happened to that shelf on day fourteen.
Phantom stockouts
An item can show as “in stock” in the inventory system because it technically exists in the backroom, while the shelf itself has been empty for days. The most widely cited benchmark on this comes from Gruen, Corsten, and Bharadwaj’s global retail audit for the Grocery Manufacturers of America, which found an average on-shelf availability (OSA) gap of 8.3% – a figure that has held up remarkably well across two decades of follow-up studies. A meaningful share of that gap goes undetected until the next scheduled store visit. Every day a facing sits empty is a lost sell-through that never shows up as a clean line item – it just shows up as a category that’s underperforming for reasons nobody can point to.
Planogram drift
Shelves rarely stay the way they were set. Facings get compressed to make room for a competitor’s display, secondary placements disappear after a reset, and price tags get swapped and never corrected. Drift is gradual by nature, which is exactly why it survives so long: nothing catches it until a formal compliance audit, and for most brands, that audit isn’t frequent enough to catch drift before it costs a full sales cycle.
Wasted trade spend
This is the leak that gets the least attention internally and does the most damage financially. Brands pay retailers for guaranteed display compliance, end-cap placement, and promotional execution – commitments that are rarely verified independently at the time they’re supposed to happen. Post-campaign audits routinely find that a meaningful share of paid-for placements were never executed as agreed, and by the time that’s discovered, the promotional window has closed and the trade dollars are already spent.
Individually, each of these looks like a rounding error against total revenue. Stacked across a full account list and a full fiscal year, they’re the reason retail AI investment gets proposed in the first place – not because computer vision is a compelling technology, but because the status quo is expensive in ways that don’t show up as a single number until someone adds them together.
What Computer Vision Recovers
Image recognition doesn’t fix these leaks by being smarter in the abstract. It fixes them by doing one specific thing well: turning a shelf photo into a timestamped, structured fact, continuously, at a fraction of the labour cost of a manual walk. Mapped against each leak above, the recovery is concrete rather than conceptual.
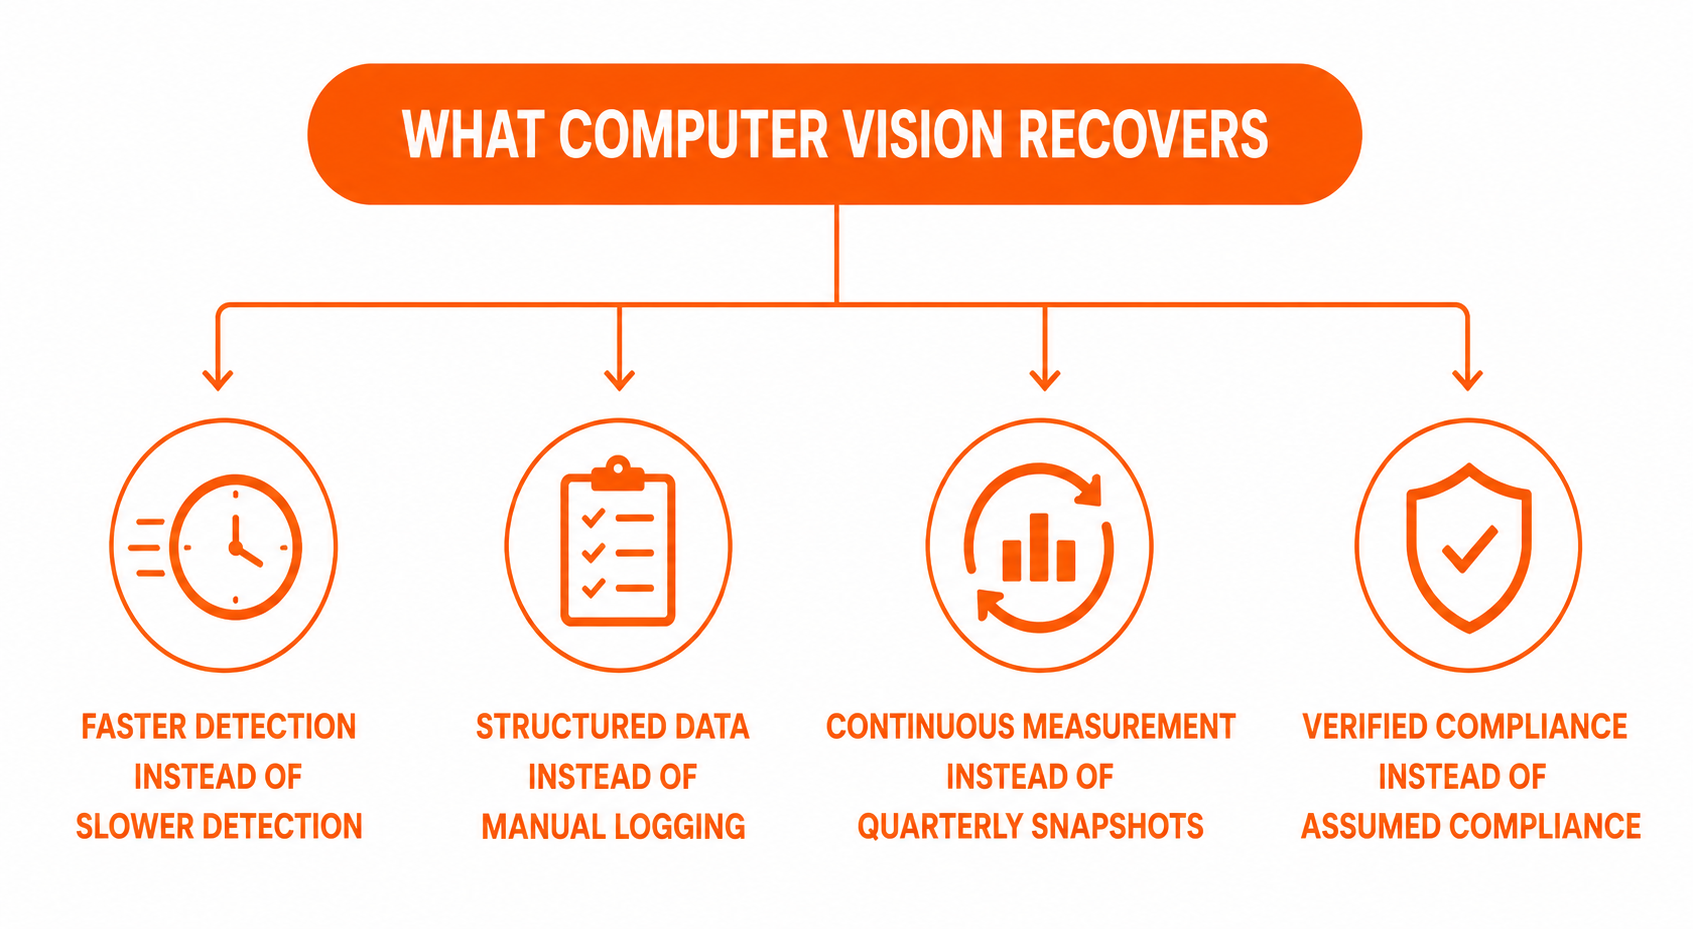
Faster detection instead of slower detection
Against phantom stockouts, the fix is speed. Instead of finding out an item has been dark for two weeks at the next scheduled visit, image recognition flags the gap within hours of a shelf photo being captured – often from an image that was going to be taken anyway as part of a routine store visit. The stockout still happens; what changes is how long it’s allowed to persist before someone acts on it.
Structured data instead of manual logging
Against manual audit labour, computer vision changes what a field rep’s time is spent on rather than eliminating the visit altogether. Instead of manually logging every SKU’s position and facing count, a shelf photo is processed in minutes and returned as structured data: what’s present, what’s missing, and where pricing doesn’t match the plan. The rep’s time shifts from data collection to resolution – fixing what’s wrong instead of documenting it.
Continuous measurement instead of quarterly snapshots
Against planogram drift, continuous capture turns compliance from a periodic audit into a running measurement. A facing count that’s off by two units, a competitor display that’s crept into contracted space, a price tag that doesn’t match the current promotion – all become visible on the same cadence as the store visits already happening, not on the cadence of a formal audit calendar.
Verified compliance instead of assumed compliance
Against wasted trade spend, this is where the recovery is most directly attributable to dollars. If a retailer was paid for a guaranteed end-cap and image recognition confirms it was never built, that’s a specific, defensible, recoverable line item – a timestamped photograph, not an estimate.
None of this is “AI improves retail operations” in the abstract. It’s four narrow, measurable substitutions: faster detection, verified compliance, and targeted labour in place of blanket labour. That specificity is what makes the ROI math in the next section possible to build with actual numbers instead of assumptions.
The Retail AI Investment ROI Math
Here is the formula a CFO can actually evaluate. Computer vision retail ROI, stripped down to its components, is not more complicated than this:
ROI = (Recovered Sales + Labor Savings + Recovered Trade Spend − Deployment Cost) ÷ Deployment Cost
Each term needs a plain-language definition before it gets a number attached to it.
Recovered sales is the revenue gained by shortening the window a stockout or misplaced facing sits unresolved. If a brand currently loses a known percentage of category sales to undetected shelf issues, and faster detection closes some portion of that gap, recovered sales are category revenue multiplied by the current loss rate, multiplied by the share of that loss now caught and fixed in time.
Labour savings is the redeployment value of field time. If image recognition cuts manual audit time per store meaningfully, that’s not necessarily a headcount reduction – for most brands, it means the same team covering more doors or spending freed-up hours on merchandising fixes instead of data entry. Either way, it has a dollar value: hours saved multiplied by fully loaded hourly cost, or additional store coverage multiplied by average revenue impact per covered store.
Recovered trade spend is the most finance-friendly line in the formula, because it’s the most direct. It’s the dollar value of contracted retailer commitments – end caps, secondary displays, and promotional pricing – that image recognition confirms were not executed and that the brand can recoup, reallocate, or decline to pay for going forward.
Deployment cost is everything it takes to run the programme: the platform subscription, any integration work with existing field force or TPM systems, onboarding, and the ongoing time cost of acting on the alerts the system generates. This is the number a CFO will interrogate hardest, so it needs to reflect the full picture – the total cost of ownership, not just the software line item.
Put those four terms together, and computer vision retail ROI stops being a directional argument and becomes a spreadsheet a finance team can stress-test. The section below runs actual numbers through it. For brands that want to model their own store count, category revenue, and current loss rate against this same formula, ParallelDots’ ROI calculator builds that projection directly – the worked example here uses illustrative figures to show how the inputs connect.
How This Looks by Stakeholder
The formula above answers the CFO's question, but the same investment case reads differently depending on who else is in the room – and CPG technology purchases typically run through 6–7 stakeholders before a deal closes. Framing recovered value through each stakeholder's own metric tends to move a proposal faster than one blended ROI number.
A CFO or finance lead reads it as annual ROI − (Revenue Protected + Cost Savings + Efficiency Gains − Technology Investment) ÷ Technology Investment – and across ShelfWatch deployments that has typically landed at 150–300% in year one, scaling toward 300–400% by year three as efficiency gains compound and onboarding costs are already absorbed. A sales director reads it as revenue protection: the model typically protects 70–80% of the revenue previously at risk from execution gaps. A trade marketing lead reads it as compliance-driven efficiency: brands typically move from an industry-average 50–65% promotional compliance rate to 90%+ with continuous shelf verification, converting a meaningful share of previously wasted trade spend into effective spend. And an operations lead reads it as time and cost recovered directly: audit time per store typically drops 40–60%, freeing field capacity without adding headcount.
These are the ranges observed across ShelfWatch deployments broadly. The worked example in the next section deliberately sits at the conservative end of that range, using a single brand's specific numbers rather than a broad benchmark.
A Worked Example: Computer Vision Retail ROI in Practice
Take a hypothetical mid-sized CPG brand – call it Fictional Foods – selling a snack line across 400 grocery doors, averaging $18,000 in annual category revenue per door. That’s a $7.2 million revenue base across the covered accounts.
Fictional Foods estimates, based on internal audit sampling, that undetected shelf issues (stockouts, drift, and missed displays) cost roughly 3% of category revenue annually – about $216,000. Under the current model, a four-person regional team visits each store roughly every four weeks, meaning the average shelf issue goes uncaught for 10 to 14 days before it’s found and fixed.
Deploying ShelfWatch across those 400 doors, using existing field reps for image capture, brings average detection time down from 12 days to under 24 hours. Fictional Foods models the recovery conservatively, assuming the faster detection catches and resolves 55% of the previously undetected loss, rather than assuming a full recovery in year one.
- Recovered sales: $216,000 × 55% = $118,800
- Labor savings: the same four-person team now completes audits in a third of the time, freeing roughly 600 hours a year for merchandising work instead of manual logging, at a fully loaded rate of $35/hour = $21,000
- Recovered trade spend: a pre-deployment audit finds that 8% of paid promotional placements across the account list weren’t executed as contracted, worth roughly $60,000 in annual trade spend – the brand recovers or reallocates half of that in year one = $30,000
- Total recovered value: $169,800
- Deployment cost (platform, integration, onboarding, and program management for 400 doors, year one): $92,000
ROI = ($169,800 − $92,000) ÷ $92,000 = 84.6% in year one, with deployment cost dropping in year two once onboarding and integration are already sunk – pushing second-year ROI well past 150% on the same recovered-value base.
That’s a first-year return built on conservative assumptions a CFO can poke holes in and still find defensible – which is a more useful number in a budget meeting than an optimistic one that doesn’t survive scrutiny.
What the Payback Timeline Looks Like
Payback isn’t uniform across everything computer vision touches – it happens in stages, and knowing which stage a program is in sets realistic expectations for the finance team reviewing it.
On-shelf availability and stockout detection typically pay back fastest, in 3 to 6 months from go-live. This is the lowest-hanging fruit because the loss is immediate and continuous, and faster detection converts directly into recovered sell-through almost as soon as the system is capturing shelf photos reliably.
Trade spend verification usually pays back within 6 to 9 months because it depends on a full promotional cycle running through the system before a brand has enough evidence to renegotiate or enforce contracted terms with a retailer.
Planogram compliance and broader merchandising standards take longer to show full return – often 9 to 12 months – because the value compounds over multiple reset cycles rather than showing up in a single quarter.
The pattern across all three: payback is measured in single-digit months for the sharpest use cases, not years, but it’s front-loaded toward the problems already costing the most today. A brand rolling out every use case at once will see a blended timeline closer to 12 months. A brand that starts with stockout detection on its highest-revenue accounts can realistically see a positive return inside two quarters – which is usually the more decision-useful number to bring into a budget conversation.
See Your Own Numbers
The formula above works the same way for any brand – what changes are the inputs: door count, category revenue, current loss rate, and deployment scope. Rather than estimating those by hand, run your own numbers through ParallelDots’ ROI calculator and get a store-count-specific projection for recovered sales, labour savings, and payback timeline before your next budget conversation.
Sources
- Gruen, T.W., Corsten, D., and Bharadwaj, S., “On Shelf Availability: An Examination of the Extent, the Causes, and the Efforts to Address Retail Out-of-Stocks,” Grocery Manufacturers of America.
Further Reading
What is computer vision retail ROI?
Computer vision retail ROI is the measurable financial return from deploying shelf-monitoring image recognition, calculated as recovered sales, labour savings, and recovered trade spend, minus total deployment cost. It’s typically expressed as a percentage return in the first year, with the ratio improving in subsequent years as onboarding costs are already absorbed.
How is ROI calculated for computer vision in retail?
Use the formula: (Recovered Sales + Labour Savings + Recovered Trade Spend − Deployment Cost) ÷ Deployment Cost. Recovered sales come from category revenue multiplied by the current undetected-loss rate and the share of that loss now caught in time; labour savings come from redeployed field hours; recovered trade spend comes from previously unverified retailer commitments.
How much does computer vision cost for a CPG brand?
Deployment cost depends on store count, integration scope, and whether existing field reps or dedicated hardware captures the shelf images. A single-use-case rollout across a few hundred doors, using existing field-force capture, typically falls in the range modelled in the worked example above – well below the cost of a hardware-heavy, multi-use-case deployment.
How long does it take to see ROI from shelf-monitoring AI?
Most single-use-case deployments become cash-flow positive within 3 to 12 months, depending on the use case. Stockout detection tends to pay back fastest, since the underlying loss is continuous and immediate. Trade spend verification and planogram compliance take longer because their value depends on full promotional or reset cycles running through the system.
Does computer vision actually reduce out-of-stocks?
It reduces the time an out-of-stock goes undetected, which is where most of the recovered revenue comes from. Rather than a shelf gap surfacing at the next scheduled store visit, weeks later, image recognition flags it within hours of a shelf photo being captured, giving field teams a much shorter window to restock before the sales opportunity is lost.
ShelfWatch runs this kind of shelf-monitoring program for CPG manufacturers across more than 50 countries, spanning packaged food, personal care, beverage, and OTC pharma categories – so the inputs in the formula above aren’t theoretical; they’re the same variables finance teams already work with when they evaluate a deployment.
.png)
.png)