Shelf Monitoring

How Real-Time Shelf-Truth Data Sharpens CPG Demand Forecasts

Vriddhi Bhagat
August 26, 2026
mins read
Ready to get Started?
request A Demo

A demand forecast missed by 22% last quarter. Not because the model was wrong – because nobody told it the product was off the shelf for nine days.

This is the quiet failure mode inside most CPG demand forecasting today. Teams keep investing in better algorithms, richer POS feeds, and tighter S&OP cycles, and the forecast still misses – because the model was never given the one fact that mattered: whether the product was actually available to be bought in the first place.

A stockout, a phantom-inventory SKU sitting “in stock” on paper but absent from the shelf, and a lost secondary display all produce the exact same signal in point-of-sale data as a genuine drop in consumer demand. To a forecasting model, they are indistinguishable. To a supply chain or category team reading the resulting order plan, they are three very different problems with three very different costs.

This is not a modeling problem. It is an input problem – and the fix is real-time shelf-truth data, not another layer of forecasting sophistication.

Key Takeaways

  • CPG demand forecasting is only as accurate as the data feeding it – and POS data alone can’t explain why a sale didn’t happen.
  • Three very different situations look identical in sales data: a real demand drop, a stockout, and a phantom-inventory SKU that’s in stock on paper but missing from the shelf.
  • When a forecasting model can't tell these apart, brands either over-order – wasting inventory and trade spend – or under-order and miss sales they could have captured.
  • Real-time shelf-truth data – image-based visibility into what’s actually on the shelf – gives AI demand forecasting in CPG the missing context to correct for execution failures instead of misreading them as demand shifts.
  • Better forecast accuracy here doesn’t come from a new model. It comes from removing execution noise from the inputs the existing model already runs on.
  • This isn't about replacing your forecasting or demand-sensing system. It's about feeding it a signal it can actually trust.

What CPG Demand Forecasting Actually Depends On

CPG demand forecasting is the process of predicting how much of each SKU will sell, at the store or DC level, over a given period – usually built on historical sales, POS data, promotional calendars, seasonality, and increasingly, real-time signals layered on top of a statistical baseline.

Forecasting demand for retail SKUs isn't a new discipline. CPG companies have been running some version of it since modern supply chain planning took shape in the 1980s and 90s. What's changed since then is the sophistication of the models, not necessarily the reliability of what feeds them.

And the accuracy of a forecast depends entirely on the accuracy of what feeds it. A model trained on clean, representative sales history behaves well. A model trained on sales history that's been silently distorted by stockouts, phantom inventory, or shelf-execution failures learns the wrong pattern – and keeps repeating it, forecast after forecast, until someone corrects the input.

That's a different question from demand sensing, which is about how quickly a forecast reacts to new signals. Demand forecasting is about whether the data that reaction is built on was ever trustworthy to begin with. (We go deeper on that distinction in our piece on demand sensing vs. demand planning – this one stays focused on the input problem itself.)

For supply chain and category teams, that distinction matters because it changes where you go looking for the fix. It isn't a smarter algorithm. It's better visibility into what's actually happening between your DC and your shelf.

The Three Confounds That Look Identical in Your Sales Data

A stockout, a phantom-inventory SKU, and a genuine drop in consumer demand can all produce the same falling line in your sales data – and no forecasting model can tell them apart from sales data alone.

Each distorts a forecast in a different direction and for a different reason. It's worth naming all three explicitly, because most demand forecasting conversations stop at “stockouts distort data” and leave it there.

Stockouts

A stockout is the most familiar case: the shelf is empty, no sale can happen, and the model reads the resulting zero as reduced demand rather than as unmet demand. Depending on how long the gap lasts and how the model weights recent history, a single multi-day stockout on a fast-moving SKU can pull a forecast down for several weeks after the shelf is restocked.

Phantom Inventory

Phantom inventory is stock that shows as available in a retailer's or brand's system of record but isn't actually present or sellable on the shelf – the result of miscounts, damage, misplacement, or theft. Because the system shows the product in stock, no stockout alert fires, and the resulting sales gap gets read as a demand problem instead of an availability problem.

Lost Shelf Space

Lost shelf space covers everything from a secondary display that didn't get rebuilt after a reset, to a facing count that shrank during a planogram change, to a competitor gaining space at a brand's expense. None of these are stockouts in the technical sense – the SKU is still on the shelf – but reduced visibility and reach still show up in sales data as reduced demand.

A Worked Example: One SKU, Three Forecasts

Numbers make this concrete faster than description does, so here's a simplified, illustrative example – not a real case study, just the math worth running before your next forecast review.

Say a mid-velocity SKU normally sells about 1,000 units a week across a retail account. Over a four-week period, POS data shows sales dropping to roughly 780 units a week – a 22% decline. Fed directly into a standard forecasting model, that decline reads as softening demand, and the model lowers its baseline forecast for the SKU going forward. The immediate response on your side: trim the next replenishment order, and potentially deprioritize the SKU's promotional calendar.

Now overlay shelf-truth data for the same four weeks. It shows the SKU was fully stocked and in place for three of the four weeks – but out of stock for nine cumulative days in week two, and missing its secondary display for all of week three after a promotional reset wasn't rebuilt on schedule. Adjusted for those two execution failures, underlying consumer demand was flat, not down 22%.

The difference between those two forecasts isn't academic. The uncorrected forecast leads to a smaller reorder, which risks a second stockout the moment real demand reasserts itself – compounding the original problem instead of resolving it. The corrected forecast keeps your replenishment aligned to actual demand, and routes the display issue to your retail execution team as a compliance fix rather than into your S&OP cycle as a demand signal.

Neither forecast required a new algorithm. The only difference was whether the model had access to what was actually happening at the shelf.

Why POS and Shipment Data Alone Can't Fix This

POS data can't resolve this on its own because it only records whether a transaction happened – not why it didn't. That's the ceiling most CPG demand forecasting has already run into.

Most forecasting has already made one real upgrade: moving from shipment or DC-reorder data to POS data, on the reasoning that POS sits closer to actual consumer demand. That upgrade is worth keeping – shipment data reflects what a distributor ordered, which can lag or overshoot actual sell-through by weeks.

But a point-of-sale system has no way of knowing why a transaction didn't happen. It can't see whether the product was on the shelf, correctly faced, priced right, or visible at all – it only sees whether someone bought it. Every layer of forecasting sophistication built on top of POS data inherits that same blind spot, because the disambiguating information never reaches the model in the first place.

What Real-Time Shelf-Truth Data Actually Is

Shelf-truth data is image-based visibility into what is actually happening on the physical shelf: whether a SKU is present, correctly faced, priced as planned, and displayed where a planogram or promotion calls for it – captured directly from stores rather than inferred from downstream sales data.

How often that picture refreshes depends on how it's captured. Field-rep photo capture refreshes at store-visit cadence; fixed in-store cameras refresh continuously. Either way, the data arrives at store-and-SKU level, which is the granularity SKU-level demand forecasting actually needs.

The distinction from POS or shipment data is what it captures, not just how fast it arrives. POS tells a forecasting model what sold. Shelf-truth data tells it what was available to sell in the first place – availability, facing, and compliance, verified at the shelf rather than assumed from a sales figure.

For CPG demand forecasting specifically, that distinction is what closes the input gap described above. Feeding shelf-truth data into AI demand forecasting in CPG gives the model a second, independent signal to check sales data against: if the shelf was empty or the display was missing, the sales dip can be attributed to execution rather than demand, and the forecast – and the resulting order plan – adjusted accordingly.

How Shelf-Truth Data Powers AI Demand Forecasting in CPG – and the ROI

In practice, this works as a correction layer rather than a replacement for existing forecasting logic. A brand's forecasting or planning system keeps running on the sales history and statistical methods it already uses; shelf-truth data adds a parallel input that flags exactly when and where a sales anomaly maps to a known execution failure rather than a real demand shift.

That correction matters because the underlying problem isn't a rounding error. IHL Group's inventory distortion research puts the cost of out-of-stocks and overstocks at $1.73 trillion a year globally – equivalent to 6.5% of global retail sales (Chain Store Age). Narrowing to this category specifically, NielsenIQ found that U.S. CPG retailers failed to realise 7.4% of sales because of out-of-stock and out-of-shelf items in 2021, costing roughly $82 billion (Food Manufacturing). Note the phrasing in that second figure: out-of-stock and out-of-shelf – a distinction only shelf-level data can actually see.

A forecast that isn't artificially depressed by an unresolved stockout supports a replenishment order sized to your actual demand, reducing the odds of a second, compounding stockout on your shelves. A forecast that isn't inflated by demand a display outage suppressed avoids overbuilding safety stock for what was really a shelf-compliance problem, not a change in appetite. And a forecast that correctly separates execution failure from genuine demand decline gives your trade and category teams a cleaner signal for where to spend the next promotional dollar – on a SKU that's actually softening, not one that simply wasn't visible to shoppers for two weeks.

[Placeholder for ParallelDots proof point – one customer result or internal benchmark (e.g. OSA lift, stockout-detection accuracy, or recovered sales for a named or anonymised brand). Every strong competitor on this SERP carries one; this is the highest-value remaining addition and needs an internally approved figure.]

None of this requires abandoning the AI demand forecasting or demand-sensing tools already in place. It requires giving them an input they've been missing.

What Shelf-Truth Data Can and Can't Fix

Shelf-truth data closes a specific gap – it is not a general-purpose fix for forecasting. Being precise about the boundary is what makes it useful.

What it can do: separate an availability-driven sales dip from a demand-driven one; surface phantom inventory that no stockout alert will catch; verify whether a promotion or display was actually executed in the stores it was funded for; and do all of that at store-and-SKU level rather than as an account-wide average.

What it can't do: correct a model that mishandles price elasticity, seasonality, or cannibalisation between your own SKUs. It won't explain a genuine demand shift caused by a competitor's pricing move, a category-level decline, weather, or a change in shopper behaviour. It doesn't replace POS data – the two answer different questions, and the correction only works when you have both. And it won't substitute for planner judgement in an S&OP cycle; it narrows what planners have to guess about, which is a different and more realistic claim.

The practical read: if your forecast error is concentrated in SKUs and stores where execution is inconsistent, shelf-truth data addresses the largest share of that error. If your error is spread evenly across a stable, well-executed base, the problem is more likely in your model's treatment of price, promotion, or seasonality – and shelf data will sharpen the picture without moving the number much.

How to Audit Your Own Forecast Inputs

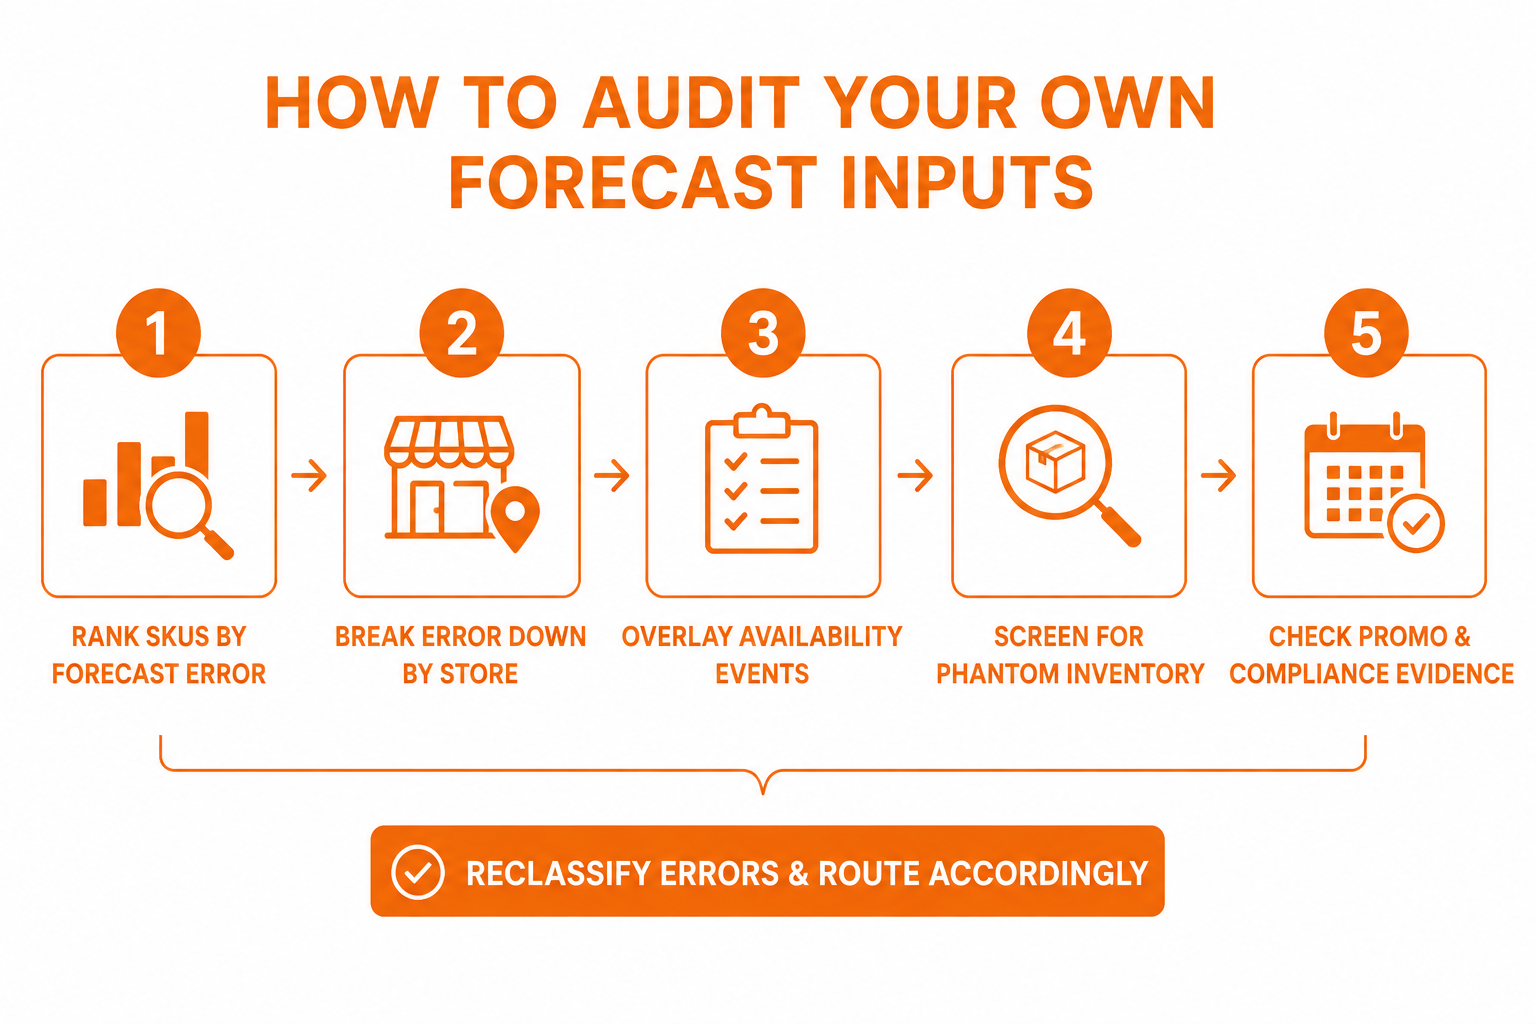
Before adding any new data source, it's worth establishing how much of your forecast error is actually execution noise. This is a five-step audit most planning teams can run on data they already hold.

  1. Rank last quarter's SKUs by forecast error. Use MAPE for magnitude and forecast bias for direction – persistent negative bias (systematic under-forecasting) on specific SKUs is the signature this article is about.
  2. Isolate the worst decile and break the error down by store, not just by SKU. Execution-driven error clusters in particular stores; demand-driven error usually doesn't.
  3. Overlay every known availability event for those SKU-store combinations – audit findings, retailer OOS reports, field-team notes. Any sales dip that lines up with a known gap is execution noise, not demand.
  4. Screen for phantom inventory: system stock above zero alongside several consecutive days of zero sell-through, in a store where the SKU normally moves. That pattern is one of the most reliable indicators available without shelf-level verification.
  5. Check your promotional periods against whatever display and planogram compliance evidence exists. Underperforming promotions are frequently compliance failures rather than weak offers – and they distort the promotional lift assumptions your model reuses next time.

Then reclassify each significant error as execution or demand, and route it accordingly – compliance issues to your retail execution and field teams, genuine shifts into your planning assumptions. If you can't complete steps three through five because the shelf-level evidence doesn't exist or arrives too late to match against a sales week, that gap is your answer: the forecast isn't underperforming because the model is weak, but because a whole category of input is missing.
Where This Fits: ShelfWatch as the Ground-Truth Source

This is where ParallelDots' ShelfWatch comes in – not as another forecasting or demand-sensing layer, but as the shelf-truth data source that sits upstream of whatever forecasting stack a brand already runs. ShelfWatch uses image recognition to verify on-shelf availability, planogram compliance, share of shelf, and promotional and price-tag execution at store level, whether images come from field-rep capture or fixed in-store cameras.

Those metrics surface in a corporate dashboard with customisable BI reporting, which is how planning and category teams get shelf-level evidence into the same view as their sales data – the practical starting point for the audit described above. (For the deeper mechanics of availability and out-of-stock impact specifically, see our posts on OOS in retail and phantom inventory, and our perfect store execution solution – this piece keeps its focus on the forecasting-accuracy argument.)

If your team is trying to trace a recurring forecast miss back to its source, that's usually the right place to start: not the model, but what the model was never shown. Request a demo to see what shelf-truth data looks like for your categories.

A demand forecast missed by 22% last quarter. Not because the model was wrong – because nobody told it the product was off the shelf for nine days.

This is the quiet failure mode inside most CPG demand forecasting today. Teams keep investing in better algorithms, richer POS feeds, and tighter S&OP cycles, and the forecast still misses – because the model was never given the one fact that mattered: whether the product was actually available to be bought in the first place.

A stockout, a phantom-inventory SKU sitting “in stock” on paper but absent from the shelf, and a lost secondary display all produce the exact same signal in point-of-sale data as a genuine drop in consumer demand. To a forecasting model, they are indistinguishable. To a supply chain or category team reading the resulting order plan, they are three very different problems with three very different costs.

This is not a modeling problem. It is an input problem – and the fix is real-time shelf-truth data, not another layer of forecasting sophistication.

Key Takeaways

  • CPG demand forecasting is only as accurate as the data feeding it – and POS data alone can’t explain why a sale didn’t happen.
  • Three very different situations look identical in sales data: a real demand drop, a stockout, and a phantom-inventory SKU that’s in stock on paper but missing from the shelf.
  • When a forecasting model can't tell these apart, brands either over-order – wasting inventory and trade spend – or under-order and miss sales they could have captured.
  • Real-time shelf-truth data – image-based visibility into what’s actually on the shelf – gives AI demand forecasting in CPG the missing context to correct for execution failures instead of misreading them as demand shifts.
  • Better forecast accuracy here doesn’t come from a new model. It comes from removing execution noise from the inputs the existing model already runs on.
  • This isn't about replacing your forecasting or demand-sensing system. It's about feeding it a signal it can actually trust.

What CPG Demand Forecasting Actually Depends On

CPG demand forecasting is the process of predicting how much of each SKU will sell, at the store or DC level, over a given period – usually built on historical sales, POS data, promotional calendars, seasonality, and increasingly, real-time signals layered on top of a statistical baseline.

Forecasting demand for retail SKUs isn't a new discipline. CPG companies have been running some version of it since modern supply chain planning took shape in the 1980s and 90s. What's changed since then is the sophistication of the models, not necessarily the reliability of what feeds them.

And the accuracy of a forecast depends entirely on the accuracy of what feeds it. A model trained on clean, representative sales history behaves well. A model trained on sales history that's been silently distorted by stockouts, phantom inventory, or shelf-execution failures learns the wrong pattern – and keeps repeating it, forecast after forecast, until someone corrects the input.

That's a different question from demand sensing, which is about how quickly a forecast reacts to new signals. Demand forecasting is about whether the data that reaction is built on was ever trustworthy to begin with. (We go deeper on that distinction in our piece on demand sensing vs. demand planning – this one stays focused on the input problem itself.)

For supply chain and category teams, that distinction matters because it changes where you go looking for the fix. It isn't a smarter algorithm. It's better visibility into what's actually happening between your DC and your shelf.

The Three Confounds That Look Identical in Your Sales Data

A stockout, a phantom-inventory SKU, and a genuine drop in consumer demand can all produce the same falling line in your sales data – and no forecasting model can tell them apart from sales data alone.

Each distorts a forecast in a different direction and for a different reason. It's worth naming all three explicitly, because most demand forecasting conversations stop at “stockouts distort data” and leave it there.

Stockouts

A stockout is the most familiar case: the shelf is empty, no sale can happen, and the model reads the resulting zero as reduced demand rather than as unmet demand. Depending on how long the gap lasts and how the model weights recent history, a single multi-day stockout on a fast-moving SKU can pull a forecast down for several weeks after the shelf is restocked.

Phantom Inventory

Phantom inventory is stock that shows as available in a retailer's or brand's system of record but isn't actually present or sellable on the shelf – the result of miscounts, damage, misplacement, or theft. Because the system shows the product in stock, no stockout alert fires, and the resulting sales gap gets read as a demand problem instead of an availability problem.

Lost Shelf Space

Lost shelf space covers everything from a secondary display that didn't get rebuilt after a reset, to a facing count that shrank during a planogram change, to a competitor gaining space at a brand's expense. None of these are stockouts in the technical sense – the SKU is still on the shelf – but reduced visibility and reach still show up in sales data as reduced demand.

A Worked Example: One SKU, Three Forecasts

Numbers make this concrete faster than description does, so here's a simplified, illustrative example – not a real case study, just the math worth running before your next forecast review.

Say a mid-velocity SKU normally sells about 1,000 units a week across a retail account. Over a four-week period, POS data shows sales dropping to roughly 780 units a week – a 22% decline. Fed directly into a standard forecasting model, that decline reads as softening demand, and the model lowers its baseline forecast for the SKU going forward. The immediate response on your side: trim the next replenishment order, and potentially deprioritize the SKU's promotional calendar.

Now overlay shelf-truth data for the same four weeks. It shows the SKU was fully stocked and in place for three of the four weeks – but out of stock for nine cumulative days in week two, and missing its secondary display for all of week three after a promotional reset wasn't rebuilt on schedule. Adjusted for those two execution failures, underlying consumer demand was flat, not down 22%.

The difference between those two forecasts isn't academic. The uncorrected forecast leads to a smaller reorder, which risks a second stockout the moment real demand reasserts itself – compounding the original problem instead of resolving it. The corrected forecast keeps your replenishment aligned to actual demand, and routes the display issue to your retail execution team as a compliance fix rather than into your S&OP cycle as a demand signal.

Neither forecast required a new algorithm. The only difference was whether the model had access to what was actually happening at the shelf.

Why POS and Shipment Data Alone Can't Fix This

POS data can't resolve this on its own because it only records whether a transaction happened – not why it didn't. That's the ceiling most CPG demand forecasting has already run into.

Most forecasting has already made one real upgrade: moving from shipment or DC-reorder data to POS data, on the reasoning that POS sits closer to actual consumer demand. That upgrade is worth keeping – shipment data reflects what a distributor ordered, which can lag or overshoot actual sell-through by weeks.

But a point-of-sale system has no way of knowing why a transaction didn't happen. It can't see whether the product was on the shelf, correctly faced, priced right, or visible at all – it only sees whether someone bought it. Every layer of forecasting sophistication built on top of POS data inherits that same blind spot, because the disambiguating information never reaches the model in the first place.

What Real-Time Shelf-Truth Data Actually Is

Shelf-truth data is image-based visibility into what is actually happening on the physical shelf: whether a SKU is present, correctly faced, priced as planned, and displayed where a planogram or promotion calls for it – captured directly from stores rather than inferred from downstream sales data.

How often that picture refreshes depends on how it's captured. Field-rep photo capture refreshes at store-visit cadence; fixed in-store cameras refresh continuously. Either way, the data arrives at store-and-SKU level, which is the granularity SKU-level demand forecasting actually needs.

The distinction from POS or shipment data is what it captures, not just how fast it arrives. POS tells a forecasting model what sold. Shelf-truth data tells it what was available to sell in the first place – availability, facing, and compliance, verified at the shelf rather than assumed from a sales figure.

For CPG demand forecasting specifically, that distinction is what closes the input gap described above. Feeding shelf-truth data into AI demand forecasting in CPG gives the model a second, independent signal to check sales data against: if the shelf was empty or the display was missing, the sales dip can be attributed to execution rather than demand, and the forecast – and the resulting order plan – adjusted accordingly.

How Shelf-Truth Data Powers AI Demand Forecasting in CPG – and the ROI

In practice, this works as a correction layer rather than a replacement for existing forecasting logic. A brand's forecasting or planning system keeps running on the sales history and statistical methods it already uses; shelf-truth data adds a parallel input that flags exactly when and where a sales anomaly maps to a known execution failure rather than a real demand shift.

That correction matters because the underlying problem isn't a rounding error. IHL Group's inventory distortion research puts the cost of out-of-stocks and overstocks at $1.73 trillion a year globally – equivalent to 6.5% of global retail sales (Chain Store Age). Narrowing to this category specifically, NielsenIQ found that U.S. CPG retailers failed to realise 7.4% of sales because of out-of-stock and out-of-shelf items in 2021, costing roughly $82 billion (Food Manufacturing). Note the phrasing in that second figure: out-of-stock and out-of-shelf – a distinction only shelf-level data can actually see.

A forecast that isn't artificially depressed by an unresolved stockout supports a replenishment order sized to your actual demand, reducing the odds of a second, compounding stockout on your shelves. A forecast that isn't inflated by demand a display outage suppressed avoids overbuilding safety stock for what was really a shelf-compliance problem, not a change in appetite. And a forecast that correctly separates execution failure from genuine demand decline gives your trade and category teams a cleaner signal for where to spend the next promotional dollar – on a SKU that's actually softening, not one that simply wasn't visible to shoppers for two weeks.

[Placeholder for ParallelDots proof point – one customer result or internal benchmark (e.g. OSA lift, stockout-detection accuracy, or recovered sales for a named or anonymised brand). Every strong competitor on this SERP carries one; this is the highest-value remaining addition and needs an internally approved figure.]

None of this requires abandoning the AI demand forecasting or demand-sensing tools already in place. It requires giving them an input they've been missing.

What Shelf-Truth Data Can and Can't Fix

Shelf-truth data closes a specific gap – it is not a general-purpose fix for forecasting. Being precise about the boundary is what makes it useful.

What it can do: separate an availability-driven sales dip from a demand-driven one; surface phantom inventory that no stockout alert will catch; verify whether a promotion or display was actually executed in the stores it was funded for; and do all of that at store-and-SKU level rather than as an account-wide average.

What it can't do: correct a model that mishandles price elasticity, seasonality, or cannibalisation between your own SKUs. It won't explain a genuine demand shift caused by a competitor's pricing move, a category-level decline, weather, or a change in shopper behaviour. It doesn't replace POS data – the two answer different questions, and the correction only works when you have both. And it won't substitute for planner judgement in an S&OP cycle; it narrows what planners have to guess about, which is a different and more realistic claim.

The practical read: if your forecast error is concentrated in SKUs and stores where execution is inconsistent, shelf-truth data addresses the largest share of that error. If your error is spread evenly across a stable, well-executed base, the problem is more likely in your model's treatment of price, promotion, or seasonality – and shelf data will sharpen the picture without moving the number much.

How to Audit Your Own Forecast Inputs

Before adding any new data source, it's worth establishing how much of your forecast error is actually execution noise. This is a five-step audit most planning teams can run on data they already hold.

  1. Rank last quarter's SKUs by forecast error. Use MAPE for magnitude and forecast bias for direction – persistent negative bias (systematic under-forecasting) on specific SKUs is the signature this article is about.
  2. Isolate the worst decile and break the error down by store, not just by SKU. Execution-driven error clusters in particular stores; demand-driven error usually doesn't.
  3. Overlay every known availability event for those SKU-store combinations – audit findings, retailer OOS reports, field-team notes. Any sales dip that lines up with a known gap is execution noise, not demand.
  4. Screen for phantom inventory: system stock above zero alongside several consecutive days of zero sell-through, in a store where the SKU normally moves. That pattern is one of the most reliable indicators available without shelf-level verification.
  5. Check your promotional periods against whatever display and planogram compliance evidence exists. Underperforming promotions are frequently compliance failures rather than weak offers – and they distort the promotional lift assumptions your model reuses next time.

Then reclassify each significant error as execution or demand, and route it accordingly – compliance issues to your retail execution and field teams, genuine shifts into your planning assumptions. If you can't complete steps three through five because the shelf-level evidence doesn't exist or arrives too late to match against a sales week, that gap is your answer: the forecast isn't underperforming because the model is weak, but because a whole category of input is missing.

Where This Fits: ShelfWatch as the Ground-Truth Source

This is where ParallelDots' ShelfWatch comes in – not as another forecasting or demand-sensing layer, but as the shelf-truth data source that sits upstream of whatever forecasting stack a brand already runs. ShelfWatch uses image recognition to verify on-shelf availability, planogram compliance, share of shelf, and promotional and price-tag execution at store level, whether images come from field-rep capture or fixed in-store cameras.

Those metrics surface in a corporate dashboard with customisable BI reporting, which is how planning and category teams get shelf-level evidence into the same view as their sales data – the practical starting point for the audit described above. (For the deeper mechanics of availability and out-of-stock impact specifically, see our posts on OOS in retail and phantom inventory, and our perfect store execution solution – this piece keeps its focus on the forecasting-accuracy argument.)

If your team is trying to trace a recurring forecast miss back to its source, that's usually the right place to start: not the model, but what the model was never shown. Request a demo to see what shelf-truth data looks like for your categories.