Share it with your network.


Introduction
Every CPG P&L tells two different stories. The top line says gross sales are healthy – volume is up, distribution is expanding, promotions are running. The bottom line, once trade spend, promotional discounts, and channel costs get subtracted, often tells a different story entirely. That gap between what a brand sells and what it actually keeps is where net revenue management lives.
Net revenue management (NRM) is the discipline of managing the levers – pricing, promotion, and mix – that determine how much of a sale survives the trip from list price to bottom-line revenue. It sits inside the broader revenue growth management strategy most CPG teams already run, but it zooms in specifically on the money that gets lost between the invoice and the P&L.
For pricing leads, trade marketing teams, and category managers, this guide breaks down what NRM actually means, how it relates to RGM, and where pricing, promotion, and mix decisions typically go wrong – plus a straightforward walkthrough of the math connecting gross sales to net revenue, and why execution data at the shelf is what makes NRM decisions reliable in the first place.
What Is Net Revenue Management in CPG?
Net revenue management is the discipline of protecting the revenue that remains after trade spend, promotional discounts, and channel costs are subtracted from gross sales. It's the difference between what a brand invoices and what it actually collects.
In practice, NRM is built on three connected levers. Pricing is what you charge and how it's structured across pack sizes and channels. Promotion is how much you spend to move volume, and whether that spend pays back. Mix is which products, channels, and customers you're actually selling through. Get any one of the three wrong, and net price realization – the average price a brand actually collects once promotions and deductions are accounted for – starts to drift below plan.
The reason NRM gets its own name, rather than living quietly inside “pricing strategy” or “trade marketing,” is that these three levers rarely fail in isolation. A pricing team can set a technically correct price-pack architecture, a trade team can negotiate a technically sound promotion calendar, and a sales team can chase technically reasonable mix targets – and the brand can still bleed margin, because no one is watching how the three interact. NRM exists to close that gap: it treats pricing, promotion, and mix as one connected system instead of three separate departments with three separate scorecards.
NRM sits inside a brand's broader revenue growth management strategy, but it isn't identical to it. RGM is the umbrella: pricing, promotion, and mix, but also distribution, assortment, and in-market execution. NRM is the narrower discipline that zeroes in on the money – making sure pricing, promotional spend, and product mix decisions actually protect margin rather than quietly eroding it.
Is Net Revenue Management the Same as Revenue Growth Management?
No. Net revenue management and revenue growth management are related but not interchangeable. RGM is the broader commercial strategy for growing revenue profitably across an entire go-to-market operation – pricing, promotion, mix, distribution, assortment, and retail execution all fall under it. NRM is the subset of RGM concerned specifically with protecting the revenue that survives the trip from gross sales to the P&L.
Think of RGM as the strategy for growing the business, and NRM as the discipline for making sure growth doesn't quietly cost more margin than it earns. A brand can grow gross sales through an RGM strategy – new distribution, wider assortment, aggressive promotion – while its net revenue actually declines, because trade spend and mix shifts are eating the gains faster than volume is generating them. That's precisely the scenario NRM exists to catch.
This distinction matters more than it might seem, because the two disciplines are often confused in industry commentary, sometimes treated as synonyms and sometimes treated as separate functions entirely. The cleanest way to think about it: RGM asks “how do we grow revenue,” and NRM asks “how much of that revenue do we actually keep.” Both questions matter, and they need different owners, different metrics, and different data.
The Three Levers of NRM: Pricing, Promotion, and Mix
NRM decisions get made – well or poorly – across three levers. Each one has its own tactics, its own failure modes, and its own relationship to net revenue.
Pricing
Pricing in an NRM context isn't just “what number goes on the shelf.” It's price-pack architecture: how price scales across pack sizes, formats, and channels so that a brand captures value from price-sensitive and premium-seeking shoppers without cannibalizing its own portfolio. A brand selling a 200g pack, a 500g pack, and a bulk pack needs each price point to make sense relative to the others – otherwise shoppers simply trade down to whichever pack offers the best per-unit value, and net revenue erodes even as unit volume looks fine.
Price elasticity – how sensitive demand is to a given price change – is the underlying math here. A price increase that looks like straightforward margin gain on paper can lose more volume than it gains in net revenue if elasticity in that category or channel is higher than assumed. The reverse is also true: some categories can absorb price increases with minimal volume loss, and NRM teams that don't test elasticity by channel and pack size leave that margin on the table.
Promotion
Promotion is usually the single largest drag on net revenue in a CPG business, and it's also the lever most prone to running on habit rather than analysis. Trade promotion optimization and trade spend optimization both mean the same underlying test: does a given promotional mechanic – a price cut, a display, a bundle – actually generate enough incremental volume to justify its cost, rather than simply pulling forward volume that would have sold anyway (often called baseline cannibalization)?
Promotional ROI is the metric that matters here, and it's also the easiest one to get wrong, because the intuitive read of a promotion – “volume went up while the discount ran” – skips two questions that actually determine whether it paid back: how much of that volume would have sold anyway at full price, and what the promotion cost once every discount, fee, and display allowance is added up. A promotion that looks like a clear win on a volume chart can still be a net loss once baseline volume and full cost are subtracted out. That's not a reason to promote less; it's a reason to measure promotions more precisely before renewing the same calendar next year out of habit.
Mix
Mix is the quietest of the three levers, and often the one that gets the least attention – which is exactly why it causes so much margin leakage. Mix management covers which SKUs, channels, and customers are actually driving sales. A brand can hit its revenue target while its mix has shifted toward lower-margin SKUs, discount channels, or customers who negotiate the deepest trade terms – and net revenue quietly falls even as the topline number looks healthy.
SKU rationalization and assortment optimization are the standard tools for managing mix: regularly reviewing which products and pack sizes are earning their shelf space and channel presence, and which are surviving mostly on habit or legacy distribution agreements. Channel mix works the same way – a shift toward e-commerce or club channels can look like growth while quietly compressing margin, if those channels carry higher fulfillment costs or deeper baseline discounting.
A Worked Example: From Gross Sales to Net Revenue
The clearest way to see how these three levers combine is to walk the math from gross sales down to net revenue for a single product line. This step-by-step progression – from list price down to what actually lands on the P&L – is often called the margin waterfall.
Start with gross sales: a brand sells $10 million worth of a product line at list price across the year. On paper, that's the headline number – the one that shows up in a topline growth report.
From there, trade spend comes off the top – off-invoice discounts, scan-based promotions, slotting fees, and retailer-funded activity. For this example, assume trade spend runs at 18% of gross sales, or $1.8 million. In practice, that share varies widely by category, retailer mix, and channel, so the number that matters for your own P&L is your actual trade spend ratio, not a generic industry figure.
Next, promotional cannibalization – the portion of “incremental” promotional volume that was actually going to sell at full price anyway – typically erodes a further slice of what looked like promotional lift. If a third of promoted volume would have sold regardless of the discount, the effective cost of the promotion is higher than the trade spend line alone suggests.
Then mix drift takes its share. If the product line's sales gradually shift toward its lowest-margin pack size or its highest-discount channel over the course of the year, the average price actually realized per unit – net price realization – falls even though nothing on the invoice changed.
By the time all three levers have played out, a brand that reported healthy gross sales can land meaningfully below plan on net revenue – not because anything went dramatically wrong, but because pricing, promotion, and mix were each managed on their own, rather than as one connected system. This is the gap NRM exists to close: not by eliminating trade spend or promotions, but by making sure every dollar spent across the three levers is earning its keep.
Why NRM Plans Break Down Without Retail Execution Data
The math above assumes the plan and the shelf agree with each other. In practice, they frequently don't – and that gap is where even well-built NRM strategies quietly lose their accuracy.
A pricing team can set a precise price-pack architecture, but that architecture only holds if the shelf price actually matches the plan at every store. Shelf pricing errors, expired promotional tags, and inconsistent price execution across a retail network are common enough that a brand's assumed net price realization and its actual net price realization can diverge meaningfully – and without shelf-level visibility, that gap stays invisible until it shows up as an unexplained margin miss weeks later.
The same is true for promotion. A trade team can negotiate a promotional mechanic and fund the retailer to support it, but the promotion only delivers its planned ROI if it's actually executed as agreed – the discount displayed correctly, the secondary display in place, the product in stock for the duration of the deal. A promotion that's funded but poorly executed at shelf still shows up as a cost on the P&L, whether or not it delivered the volume it was designed to drive.
Mix is affected too, in a subtler way: a brand can't accurately judge whether a SKU or channel is underperforming on merit if on-shelf availability is inconsistent or planogram compliance is low – both of which quietly suppress sales at the point of purchase. A product that looks like a weak mix contributor might simply be a product that's frequently missing from the shelf.
This is where retail execution data – shelf-level visibility into pricing, promotional compliance, and on-shelf availability – becomes part of the NRM toolkit rather than a separate retail-operations concern. Platforms like ShelfWatch capture this by turning shelf images into structured pricing, compliance, and availability data, so pricing and trade teams can confirm plans are landing as intended rather than assuming they are. Teams working from real shelf data are working from real numbers; teams relying on planning assumptions and lagged audit data are working from a model that may already be out of date. For a closer look at how execution visibility connects specifically to promotional spend, see Trade Spend Management: Protect Your Promo ROI.
Not sure how far your plan and your shelf have drifted?
Most teams find the gap is bigger than expected, particularly on promotional compliance. If you want to see what shelf-level pricing and availability data looks like for your categories, we can walk you through it on a short call.
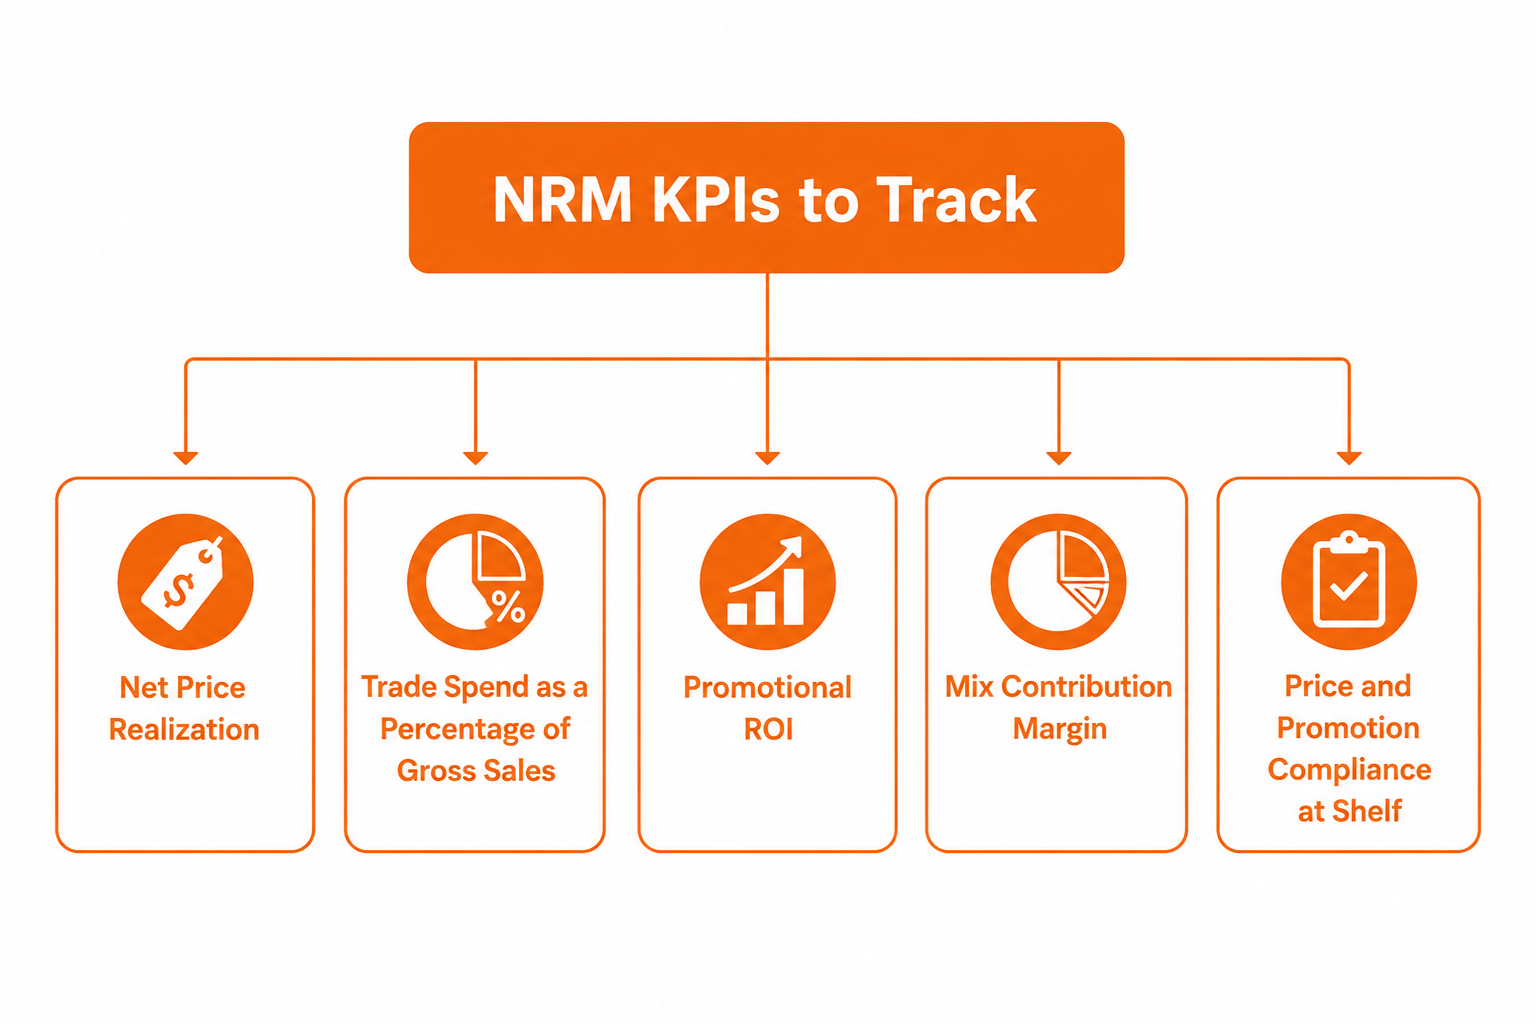
NRM KPIs to Track
The core NRM KPIs are net price realization, trade spend as a percentage of gross sales, promotional ROI, mix contribution margin, and price/promotion compliance at shelf. A short, focused set of metrics is generally more useful than a long dashboard nobody checks consistently.
Net price realization (net revenue ÷ units sold) – the average price actually collected per unit after all discounts, promotions, and trade deductions, tracked over time and by channel.
Trade spend as a percentage of gross sales – a rising ratio without a corresponding rise in incremental volume is an early warning sign that promotional spend is drifting from investment toward habit.
Promotional ROI – incremental profit generated by a promotion relative to its full cost, measured against baseline volume rather than total volume during the promotional window.
Mix contribution margin – margin generated by product, channel, and customer segment, reviewed regularly enough to catch drift before it compounds across a full fiscal year.
Price and promotion compliance at shelf – the rate at which planned pricing and promotional execution actually matches what's happening in stores, which underpins the accuracy of every metric above it.
Getting Started with NRM
NRM doesn't require an enterprise-scale rebuild to start delivering value. A practical starting sequence for pricing, trade marketing, and category teams looks like this:
Baseline the leak first. Get a clear read on where gross sales are actually converting to net revenue today – by product line, channel, and customer – before deciding which lever to focus on. It's common to assume promotion is the biggest leak when mix drift or pricing architecture is the larger issue.
Connect the three levers into one view. Even a basic combined view of pricing, promotion, and mix data beats three separate reports owned by three separate teams. The value of NRM comes from seeing the levers together, not from optimizing any one in isolation.
Verify plan against shelf reality. Build a way to confirm that pricing, promotional execution, and availability at the shelf actually match what was planned – every NRM decision is only as reliable as the data confirming it happened as intended.
Shorten the review cycle. Review mix and pricing decisions on a cadence tighter than the annual planning cycle. Quarterly or even monthly reviews catch drift while it's still a small correction rather than a full-year miss.
Net revenue management works best as part of a connected RGM strategy rather than a standalone fix. For the broader view of how pricing, promotion, mix, distribution, and execution fit together, see the full Revenue Growth Management guide for CPG.
FAQs
What is net revenue management in simple terms?
Net revenue management is the practice of managing pricing, promotion, and product mix so that a CPG brand keeps as much of its gross sales as possible after trade spend, discounts, and channel costs are subtracted.
How is net revenue management different from revenue growth management?
Revenue growth management is the broader strategy for growing revenue across pricing, promotion, mix, distribution, and execution. Net revenue management is the narrower discipline within RGM focused specifically on protecting the revenue that survives trade spend and promotional deductions.
What are the main levers of net revenue management?
The three core levers are pricing (price-pack architecture and elasticity), promotion (trade spend and promotional ROI), and mix (SKU, channel, and customer contribution margin).
How do you calculate net revenue in CPG?
Net revenue is calculated by starting with gross sales and subtracting trade spend, promotional discounts, returns and allowances, and channel-specific costs. What remains is the revenue that actually reaches the P&L – a progression often called the margin waterfall.
What is net price realisation?
Net price realisation is the average price a brand actually collects per unit once all discounts, promotions, and trade deductions are accounted for – calculated as net revenue divided by units sold.
Why does net revenue management fail in practice?
NRM plans typically break down when pricing and promotional decisions are made without visibility into whether they're actually being executed correctly at the shelf – meaning the plan and the in-store reality quietly diverge.
How does retail execution data improve net revenue management?
It closes the gap between planned pricing/promotion and what's actually happening in stores – confirming that promoted prices, displays, and availability match the plan, so NRM metrics reflect reality rather than assumptions.
What KPIs measure net revenue management success?
The most common KPIs are net price realisation, trade spend as a percentage of gross sales, promotional ROI, mix contribution margin, and price/promotion compliance at shelf.
.png)
.png)
.png)