Share it with your network.


At a Glance
- RGM and NRM are not interchangeable. The terms describe different scopes, and the difference matters when you are evaluating vendors or writing a job description.
- Ownership is the failure point. Most RGM strategies stall because no single function owns the levers end to end, not because the strategy was wrong.
- Sequence beats coverage. Brands that pull two levers well outperform brands that pull five levers partially.
- Plans are measured, execution often is not. Without shelf-level verification, a failed price move and a failed execution look identical in the data.
Most CPG organisations already have revenue growth management on a slide. Far fewer have it as an operating routine.
The strategy usually exists. Someone has mapped the pricing corridors, someone else has a promotional calendar, and a third team owns assortment reviews. What is missing is the connective tissue: a clear owner per lever, a sequence for implementation, and a measurement loop that can tell the difference between a plan that was wrong and a plan that was never executed.
That gap is expensive. McKinsey puts the prize for CPG companies with mature RGM capability at a three to seven percent improvement in return on sales, and up to ten percent profitable top-line growth. The range is wide, and the reason it is wide has less to do with analytical sophistication than with operating discipline. The brands at the top of it are not running smarter models than the brands at the bottom. They are running comparable models with clearer ownership and better execution data.
This guide covers how to build revenue growth management in CPG as an operating model rather than a strategy document. If you are looking for the underlying concepts and best practices first, our guide to RGM strategies for CPG brands covers that ground, and our breakdown of how shelf data powers RGM explains the data layer underneath it.
Revenue Growth Management or Net Revenue Management: Which Term Are You Actually Using?
Before you build anything, settle the vocabulary. This trips up more CPG teams than it should, particularly during vendor evaluation, where two providers can describe genuinely different products using the same words.
Revenue growth management (RGM) is the broader term. It covers the full set of commercial levers a brand uses to grow revenue and profit: pricing, pack architecture, promotional investment, assortment, and channel or customer mix. Its remit is total revenue, not just promoted revenue.
Net revenue management (NRM) is narrower in most usages and sits closer to finance. It focuses on the bridge between gross and net revenue, which means trade terms, discounts, allowances, returns, and everything else that erodes list price before it reaches the P&L. If gross-to-net leakage is the problem, NRM is the discipline.
In practice the terms have converged, and a growing number of organisations use them interchangeably. Unilever, Reckitt and others have used both across different markets and eras. But the practical distinction still matters in three situations:
- Vendor selection. An NRM tool that models trade terms will not help you optimise pack-price architecture. Ask which scope the platform actually covers.
- Org design. RGM teams typically sit in commercial or sales. NRM teams more often sit in finance. Where the function reports changes what it can influence.
- Scorecards. NRM tends to be measured on realised net revenue per unit. RGM is measured on revenue and profit growth across the portfolio. Mixing the two produces targets nobody can hit.
If you are building the function from scratch, pick one term, define its scope in writing, and use it consistently. Ambiguity here shows up later as duplicated effort between finance and sales.
Who Owns Which Lever
The single most common reason revenue growth management fails in CPG is not analytical. It is organisational. Pricing sits with finance, promotions sit with trade marketing, assortment sits with category management, and execution sits with field sales. Each function optimises its own lever, and nobody owns the interaction between them.
A workable ownership map looks roughly like this.
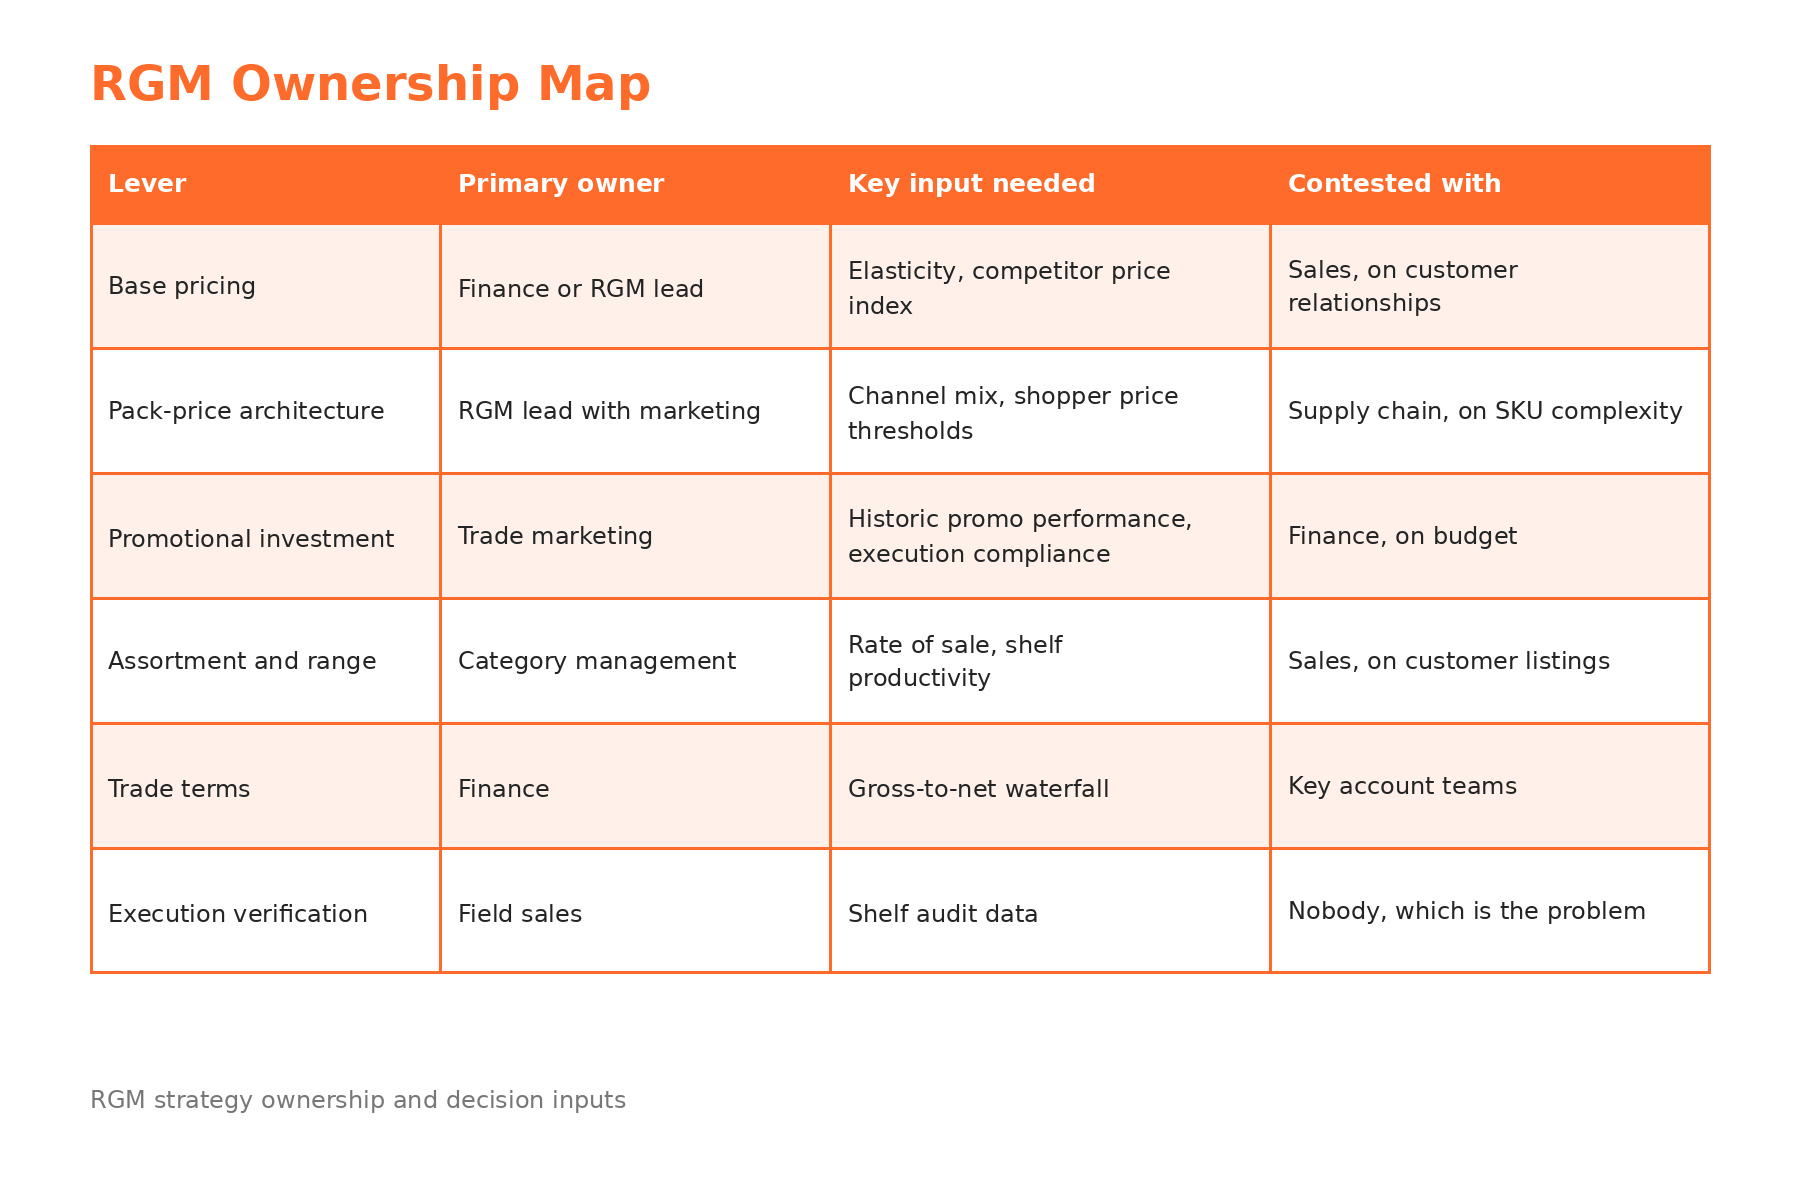
That last row is the one to look at. Execution verification is rarely anyone's explicit responsibility, which means when a lever underperforms there is no owner accountable for establishing whether the plan or the execution failed. Assign it deliberately. In most organisations it belongs with field sales operations, reporting into whoever owns the RGM function overall.
Two structural decisions are worth making early:
Does RGM own decisions or recommendations? A team that only recommends will be overruled by key accounts whenever a customer pushes back. If RGM cannot say no to a promotion, it is an analytics function, not a management function.
What is the review cadence, and who is in the room? Monthly is usually right for promotional performance, quarterly for pricing and assortment. The cadence dies within two months if the attendee list is unclear, so name roles rather than people.
Sequencing the Build: What to Do in the First Two Quarters
Coverage is the wrong goal. A brand that executes pricing and promotional compliance well will beat a brand that has partial programmes running across all five levers. Sequence accordingly.
Phase One: Establish the baseline (weeks 1 to 6)
The objective is an honest inventory of what you can currently see, not what you plan to change.
- Map data availability per lever. For each one, can you answer what happened last quarter, at what granularity, and with what lag?
- Identify where you have plan data but no execution data. Most brands find they know what price they intended and what promotion they funded, but not what appeared in store.
- Establish a competitive price index for your top SKUs in your priority channels.
- Output artefact: a lever-by-lever data readiness map, with each lever marked as instrumented, partially instrumented, or blind.
Expect the blind entries to cluster around execution. That is normal and it is useful to have documented before anyone commits to targets.
Phase Two: Prioritise the levers (weeks 7 to 12)
- Score each lever on estimated revenue impact and implementation effort. Effort should include data readiness from Phase One, not just analytical complexity.
- Select two levers. Not five.
- Assign a named owner and a target per lever. Targets should be ranges, not points, in the first cycle.
- Output artefact: a prioritised lever shortlist with owners, targets, and the specific decisions each owner is authorised to make.
The discipline here is subtractive. The levers you consciously defer should be written down as deferred, with a revisit date, so they do not quietly reappear as informal projects.
Phase Three: Instrument before you launch (weeks 13 to 18)
This is the phase most often skipped, and skipping it is why RGM results are hard to defend twelve months later.
- Define the measurement method for each selected lever before the first change goes live.
- Establish the execution data feed. If you are changing price, you need to know whether the price tag changed in store. If you are funding a display, you need to know whether the display was built.
- Agree the counterfactual. Control stores, prior period, or modelled baseline. Pick one and document why.
- Output artefact: a measurement specification, one page per lever, agreed by both the lever owner and finance.
Phase Four: Run and review (week 19 onward)
- Execute the two prioritised levers.
- Hold the review cadence even when there is nothing dramatic to report. Cadence survives on consistency, not on content.
- At the end of the first full cycle, separate results into three buckets: the plan worked, the plan was wrong, and the plan was never executed. That third bucket is usually larger than expected, and it is only visible if Phase Three was done properly.
- Output artefact: a cycle review that attributes variance to plan or execution for every lever.
The Attribution Problem That Undermines Most RGM Programmes
Two brands run an identical price architecture change in the same market. One sees the volume response the elasticity model predicted. The other sees nothing.
In the reporting, both look like a modelling failure. In reality, only one of them is. In the second case the new price never made it to a meaningful share of shelf tags, or the pack that was supposed to anchor the ladder was out of stock through the measurement window, or the competitor ran an unplanned promotion that nobody logged.
Without shelf-level verification, these are indistinguishable from a bad model. The consequence is predictable and damaging: the team loses confidence in the analytics, reverts to negotiation-led decision making, and the RGM function becomes a reporting exercise.
Closing that gap requires execution data at the same granularity as the plan. Specifically:
- Price tag presence and accuracy at store level, so a price change can be verified rather than assumed
- On-shelf availability for the SKUs carrying the lever, since a pack that is not on shelf cannot deliver a pack architecture change. Our guide to digital shelf monitoring covers what to track here
- Promotional and display compliance, because trade spend that funds a display which is never built is a leakage problem, not a promotion problem. This is covered in more depth in our guide to trade spend management
- Share of shelf against the assortment plan, to verify that listing wins translated into physical space. The distinction between share of shelf and share of market matters when interpreting this
- Competitor activity at the shelf, so unplanned competitive moves are logged rather than absorbed into your variance
Note that all five of these are execution measures, not planning measures. Planning tools such as trade promotion management systems do not capture them, which is why brands with mature planning stacks still struggle to attribute RGM outcomes.
Where RGM Strategies Break Down
Five failure modes account for most stalled programmes. All of them are organisational rather than analytical.
Too many levers at once. The programme dilutes, no lever gets sufficient attention, and results are ambiguous enough that the next cycle gets deprioritised.
No authority behind the recommendation. RGM produces a pricing corridor, a key account overrides it to protect a customer relationship, and the corridor becomes advisory. Within two quarters nobody references it.
Measurement designed after launch. Without a pre-agreed counterfactual, every result becomes negotiable, and the discussion moves from what happened to whose baseline is correct.
Assortment decisions made without shelf productivity data. Range reviews based on sales volume alone tend to protect SKUs that occupy disproportionate space. Our guide to SKU rationalisation covers how to bring shelf productivity into the decision.
Review cadence collapse. The first two reviews are well attended. The third is rescheduled. By the fifth, the meeting is a status email. Protecting the cadence is a leadership responsibility, not an analyst one.
How ParallelDots Supports RGM Execution
ParallelDots does not plan your pricing or model your elasticity. It closes the verification gap that makes those plans measurable.
ShelfWatch uses image recognition to convert a single shelf photograph into store-level execution data: on-shelf availability, price tag presence, planogram compliance, share of shelf, and promotional display verification. For an RGM function, that produces three specific capabilities:
- Verified price changes. Confirm that a pricing decision reached the shelf, at what proportion of stores, and how quickly, rather than assuming compliance
- Attributable promotional performance. Separate promotions that underperformed from promotions that were never executed, which changes both the analysis and the customer conversation
- Assortment reality checks. Compare the planned range against what is physically present and how much space it holds
These are execution measures, not planning outputs, which is why they close a gap that planning systems structurally cannot.
The result is that variance in your RGM results can be attributed rather than debated.
Request a demo to see how execution data fits into your RGM measurement loop.
FAQs
What is the difference between revenue growth management and net revenue management in CPG?
RGM covers the full commercial lever set including pricing, pack architecture, promotion, assortment and mix, and typically sits in commercial or sales. NRM focuses more narrowly on the gross-to-net bridge including trade terms, discounts and allowances, and more often sits in finance. Many organisations now use the terms interchangeably, but the scope difference matters during vendor selection and org design.
Where should the RGM function report?
Most commonly into commercial or sales leadership, with a strong dotted line to finance. The critical test is not the reporting line but whether the function can decline a promotion or hold a pricing corridor when a key account pushes back. Without that authority it functions as analytics rather than management.
How many levers should a CPG brand start with?
Two. Brands that attempt all five simultaneously typically produce ambiguous results in the first cycle, which makes the programme harder to fund in the second.
How long before an RGM strategy shows results?
Plan for one full cycle of roughly six months before results are defensible, assuming measurement was specified before launch. Programmes that skip the instrumentation phase often produce numbers faster but cannot defend them under scrutiny.
Do we need a data science team to run RGM?
Not to start. Elasticity modelling benefits from one, but the first two phases are inventory and prioritisation work. The more common constraint is execution data availability, not analytical capability.
.png)
.png)
.png)