Share it with your network.
How CPG Brands Protect Promo ROI
A CPG brand approves a promotion, funds the discount, ships the display kits, and books the trade spend against the campaign. Weeks later, sell-through comes in soft. The post-mortem asks whether the offer was wrong, the timing was off, or the category was simply flat. The question almost no one can answer with evidence is the most basic one: did the promotion actually run the way it was funded to run – the right price at the shelf, the display built, the SKU in stock – in every store that was paid for?
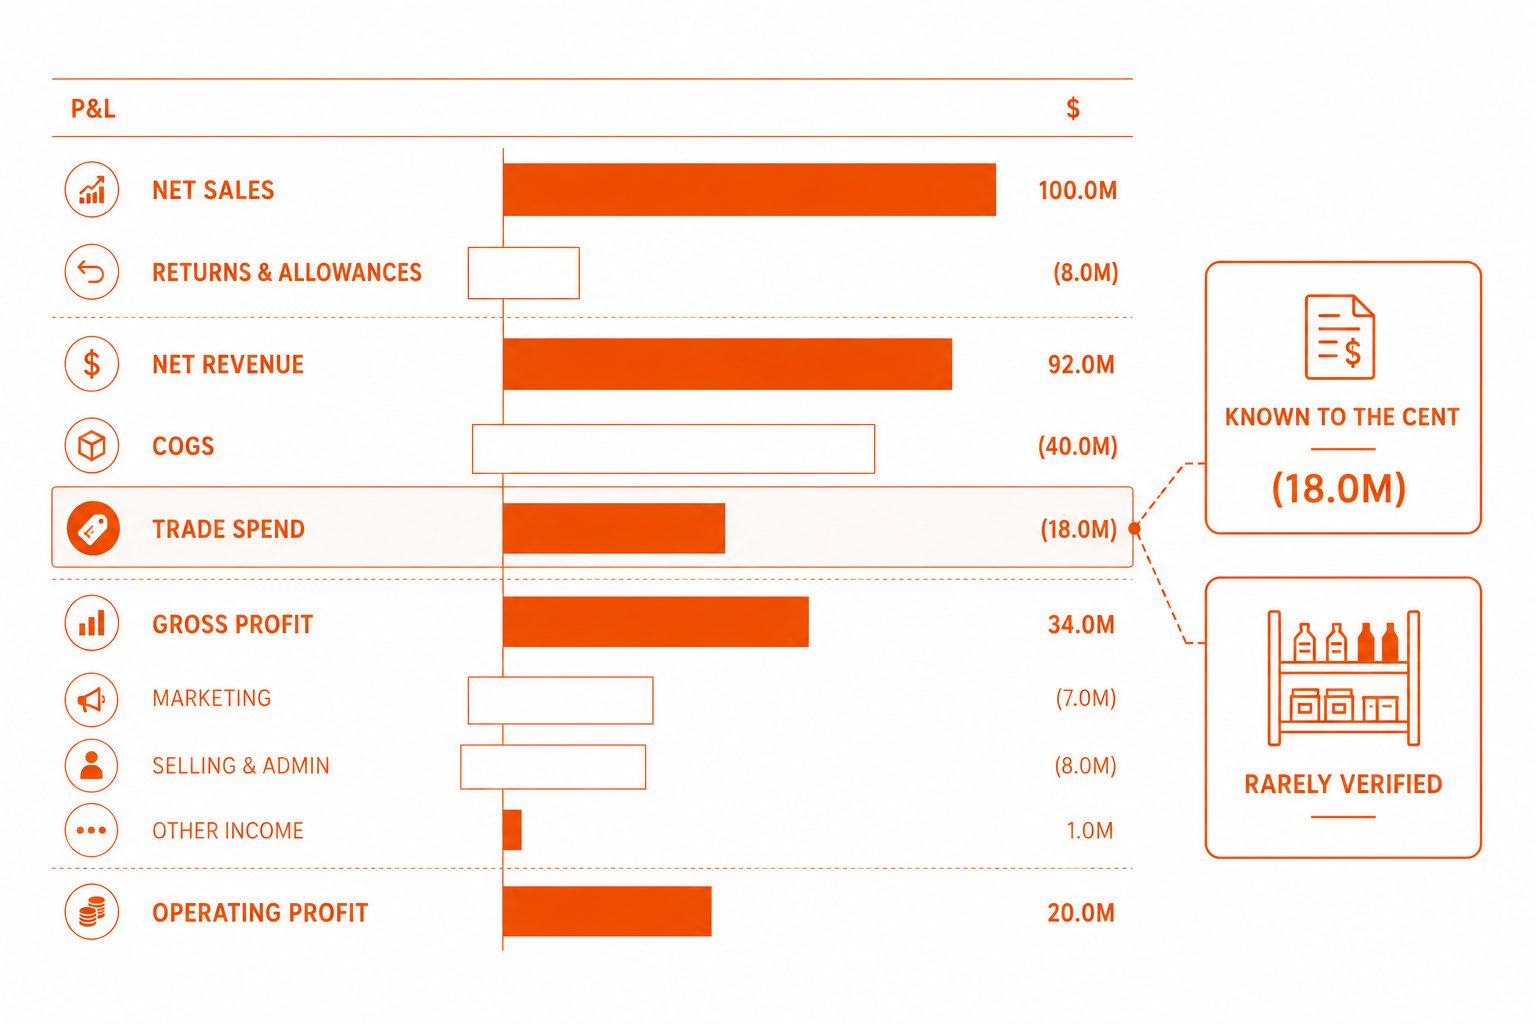
Trade spend, the money a manufacturer pays retailers and distributors to discount, display, and promote its products, is typically the second-largest line on a CPG P&L after the cost of goods. It is planned at headquarters, negotiated with accounts, and reconciled in finance. But the single moment that decides whether any of it pays off happens somewhere a spreadsheet cannot see: on a physical shelf, during the activation window, across hundreds or thousands of stores. When that moment goes unverified, every number downstream – compliance, incremental lift, ROI – inherits the same blind spot.
This blog explains what trade spend management is, why it sits at the centre of CPG profitability, and why the discipline breaks down when execution at the shelf cannot be confirmed. It covers how trade spend ROI is actually calculated, where the standard approach leaves money exposed, and what it takes to protect promotional return by closing the gap between what was funded and what reached the aisle. For a wider view of how these commercial levers connect, see our guide on revenue growth management for CPG.
Key Takeaways
- Trade spend is usually the second-largest line on a CPG P&L, typically 15–25% of gross sales.
- You cannot optimise trade spend you cannot verify – ROI is only as reliable as the proof a promotion ran at the shelf.
- A large share of trade promotions never break even, and unverified execution is a major reason why.
- The blind spot sits between funding and sell-out: plans and deductions get checked on paper, not at the shelf.
- Protecting promo ROI is an execution-evidence problem, solved with store-level proof during the activation window.
Trade Spend Is the Second-Largest Line on the CPG P&L – and the Hardest to Verify
Every promotional dollar a brand commits is a bet that a discount, a feature, or a display will return more in incremental sales than it gives up in margin. Trade spend management is the discipline of placing those bets well: planning them, funding them, tracking them, and judging which ones paid off. The reason it carries so much weight is plain arithmetic. For most manufacturers, trade is one of the largest controllable costs in the business, second only to the cost of making the product itself, and it routinely absorbs 15–25% of gross sales.
What is trade spend? Trade spend is the money a CPG manufacturer pays retailers and distributors to stock, discount, display, and promote its products, usually measured as a percentage of sales. It spans promotional price reductions, slotting and listing fees, display allowances, and rebates.
What is trade spend management? Trade spend management is the process CPG manufacturers use to plan, fund, track, and analyse the money they pay retailers and distributors to promote their products – including promotional discounts, slotting and listing fees, display allowances, and rebates. Its purpose is to direct every trade dollar toward the activities that generate profitable incremental sales and to account for that spend accurately across the P&L.
The components of trade spend
Trade spend is not a single cost but a mix of commitments, and they do not all behave the same way. Promotional allowances – the funded discount that moves a product from its everyday price to a feature price – make up the large majority of most trade budgets. Around them sit slotting and listing fees that buy distribution for new items, display and merchandising allowances that fund secondary placements, payment-term discounts, and a long tail of deductions for damages, shortages, and spoilage. Across all of it, the industry draws one important line: between working and non-working trade spend.
How much do CPG companies spend on trade? Trade spend typically accounts for 15–25% of a CPG manufacturer's gross sales, though the exact share varies by category, channel, and competitive intensity. For many brands it is the single largest cost after the cost of goods, which is why even a few points of wasted spend translate into a meaningful hit to profit.
What is the difference between working and non-working trade spend? Working trade spend funds activity a shopper can see and act on, such as a promotional price cut or an in-store display. Non-working trade spend covers costs that do not directly drive purchase, such as administrative fees, slotting charges, and deductions for damages or spoilage. The distinction matters because working spend only works if the promotion is actually executed at the shelf – when execution fails, budgeted working spend quietly turns into waste.
Why a number this large stays this hard to see
The difficulty is that trade spend is one of the few costs of its size that a brand commits centrally but consumes in tens of thousands of separate locations. Finance can see precisely how much money left the business and which account it was promised to. What no ledger records is whether the funded price was live on the shelf-edge label, whether the display was built and held up for the full window, and whether the promoted SKU was in stock when shoppers came looking for it. That distance – between a number finance knows to the cent and an execution reality almost no one measures – is where promotional return is quietly won or lost. It is also where the ROI math begins to bend.
Also Read: On-Shelf Availability and Its Business Impact – how the same verification gap drains revenue through stockouts, not just promotions.
Why Trade Spend ROI Math Collapses on Unverified Execution
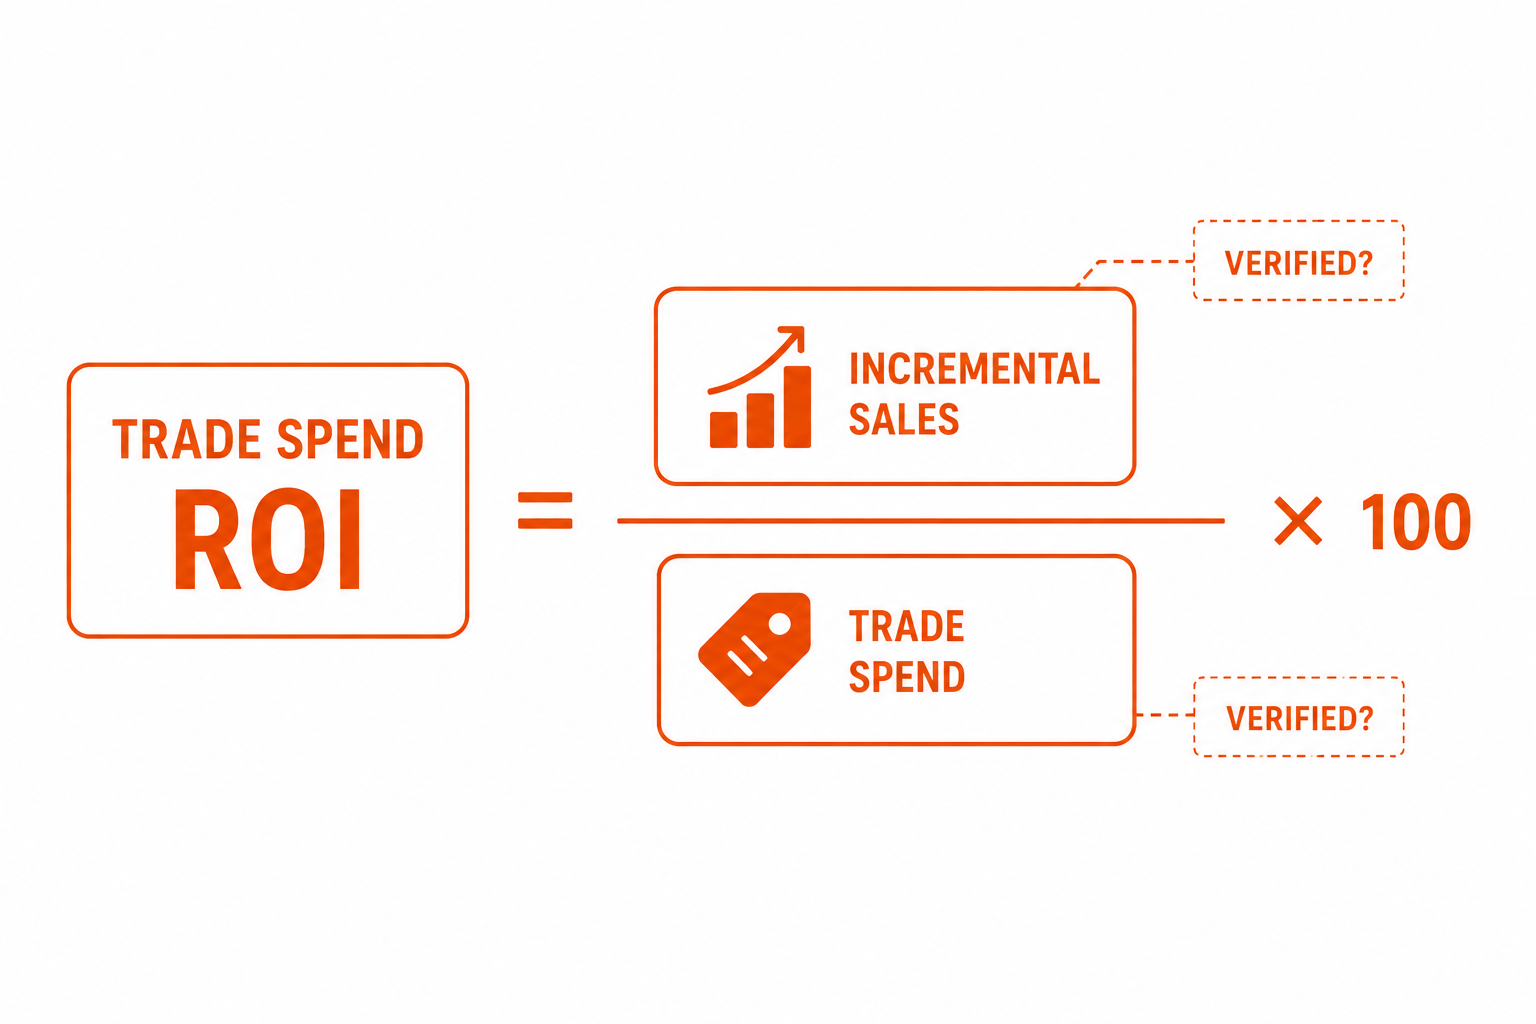
The purpose of all this spending is return, and return has a formula. Trade spend ROI compares the incremental sales a promotion generated against the trade investment that funded it. On paper it is clean. In practice, both halves of the equation depend on something most brands never confirm: that the promotion happened as designed, in the stores that were paid for, for the full window it was funded.
How is trade spend ROI calculated? Trade spend ROI is calculated as incremental sales generated by a promotion divided by the trade spend that funded it, usually expressed as a ratio or a percentage. Incremental sales are the lift above the baseline a product would have sold without the promotion, which is why an accurate baseline – and proof the promotion actually ran – are essential to a number that means anything.
How do you calculate trade spend as a percentage of sales? Trade spend as a percentage of sales is total trade spend divided by net sales, multiplied by 100. A complete figure captures every cost tied to the promotion, including off-invoice discounts, scan-downs, display allowances, and broker commissions, not just the headline price reduction.
The scale of the problem is well understood inside the industry: a large share of trade promotions never break even. When a promotion fails to clear that bar, the instinct is to blame the offer or the consumer. But a promotion that was never fully executed – the display that was not built, the price that never changed, the SKU that ran out on day three – fails for a reason that no offer redesign can fix. Worse, post-promotion trade spend analysis based only on sell-out data cannot tell the two apart. A weak promotion and a promotion that barely ran produce the same disappointing curve, so the same inefficiencies get diagnosed wrong and funded again in the next cycle.
The measurement was never easy to begin with. Isolating true incremental lift means separating the sales a promotion genuinely created from the volume that would have sold anyway, the demand it pulled forward from future weeks, and the share it cannibalised from the brand's own full-price lines. Each of those adjustments rests on a trustworthy baseline. Layer unverified execution on top, where a promotion ran cleanly in some stores and not at all in others, and the analysis is no longer modelling a clean event. It is averaging events that may never have happened the way the records assume.
This is the heart of the matter. You cannot optimise what you cannot verify. As long as the execution behind a promotion is assumed rather than measured, every ROI figure built on top of it is an estimate wearing the costume of a fact.
What Trade Spend Optimization Misses When It Can't See the Shelf
Most trade spend optimisation works on the data it can reach: planned calendars, agreed terms, shipment figures, and deduction records. That data describes the intent of a promotion and its financial settlement. It says almost nothing about the event itself – what a shopper actually encountered in the aisle during the days the money was live. Trade promotion management and trade spend software have become very good at modelling the plan and reconciling the invoice, while the middle of the lifecycle, the execution, stays largely unmeasured.
The gap shows up in familiar ways. A national promotion is scheduled to go live on a Monday across thousands of stores; in a meaningful share of them, the display appears days late or not at all, and the shelf-edge price never updates. Field teams audit what they can, but manual checks are periodic, qualitative, and reach only a fraction of the network. By the time anyone notices a pattern, the activation window has closed and the spend is gone. The optimisation engine, fed only plan-and-settlement data, never sees the variance – so it keeps optimising around a reality that did not occur.
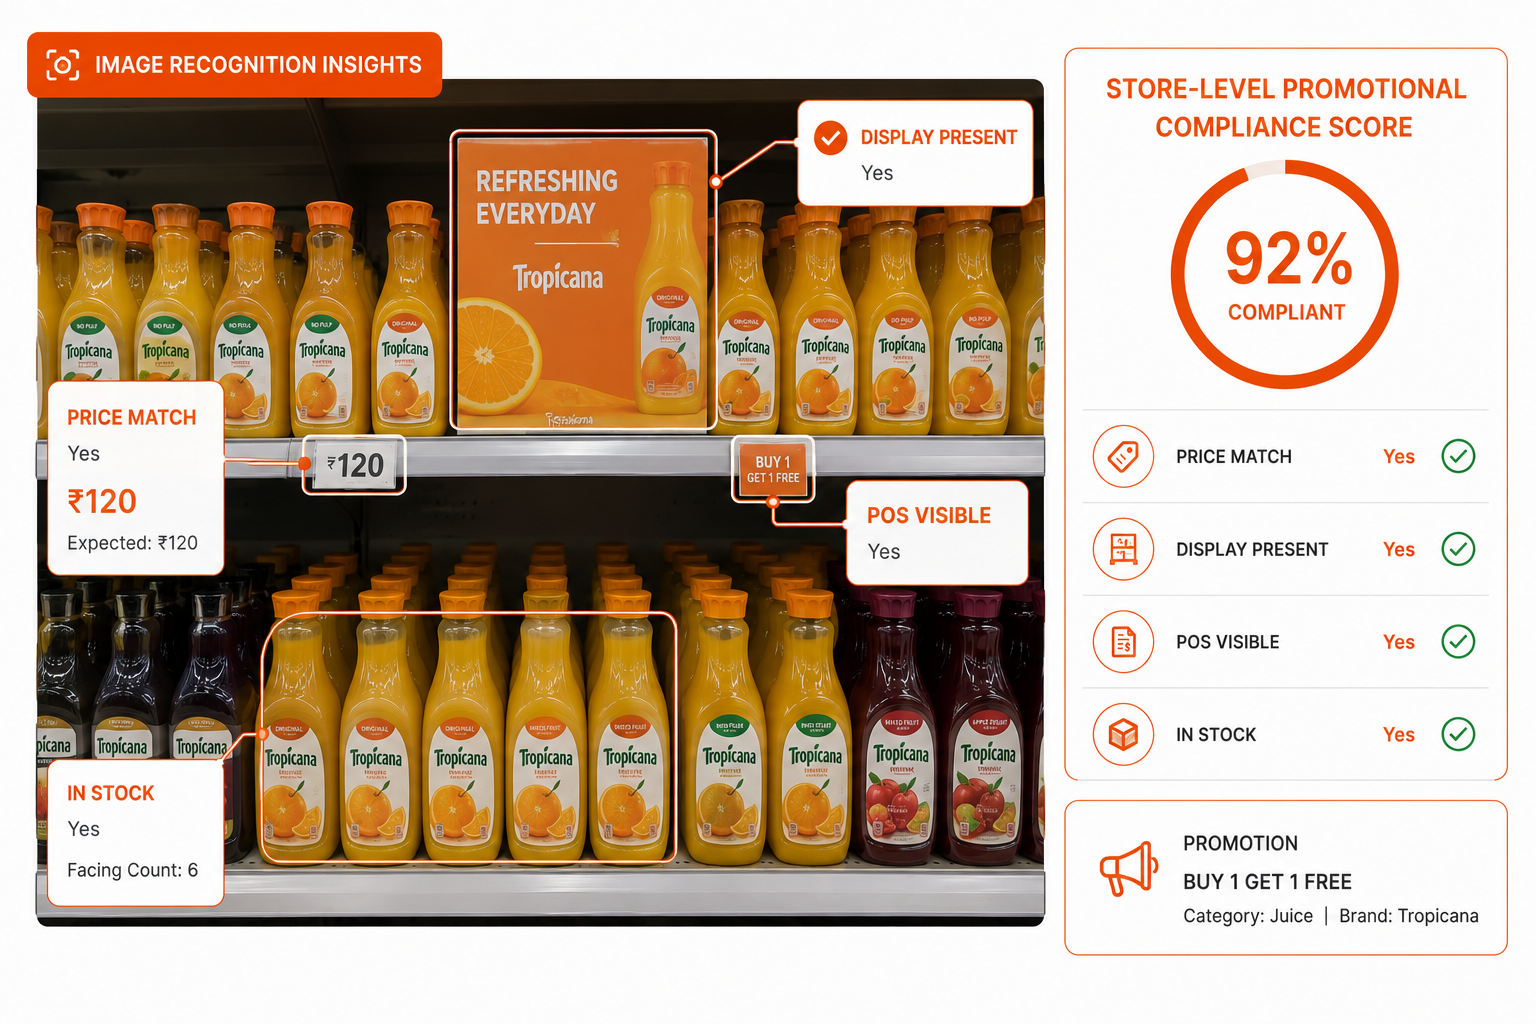
Closing that gap means treating execution as structured data, captured at the shelf during the window rather than being inferred from records afterward. This is where AI-powered shelf intelligence has become the missing input. ParallelDots' ShelfWatch processes photographs of the shelf through computer vision and returns the conditions that actually determine whether trade spend worked: whether the promotional price is displayed correctly; whether the display or secondary placement is in position; whether point-of-sale materials are up; and whether the promoted SKU is in stock – measured store by store and surfaced in time for field teams to correct a failing store while the promotion is still live. Against the agreed promotional brief rather than a generic standard, that turns compliance from an after-the-fact guess into a number a brand can act on, and it gives the ROI calculation an execution input it never had.
Execution risk is also not spread evenly, which is exactly why store-level visibility matters. Modern trade, general trade, and emerging channels each carry different compliance dynamics. A promotion that executes cleanly across a national hypermarket chain may barely register in thousands of independent outlets, where displays are negotiated store by store and shelf pricing drifts the fastest. Without data at that grain, a brand cannot tell a channel-wide execution failure from a handful of weak accounts, so field investment gets spread evenly instead of aimed at the stores where the spend is actually leaking.
The shift is from a post-mortem to a feedback loop. When a brand can see, mid-campaign, that a share of its stores are not executing, and exactly which ones - it can redirect field effort to the highest-value accounts before the window closes, rather than discovering the shortfall after the spend is gone. Later, the same execution record lets the team separate genuine demand signals from execution failures when it judges the promotion. The spend stops being a leap of faith and starts being something a team can steer.
Also Read: Trade Promotion Optimization for CPG Success – how execution data sharpens the promotions worth repeating.
Trade Spend Management Questions Category Teams Actually Ask
What is the difference between trade promotion management and trade spend management? Trade promotion management (TPM) plans, executes, and tracks individual promotional events with retailers – the discounts, displays, and activations. Trade spend management (TSM) governs the whole financial envelope: budgeting, controlling, and analysing every trade dollar across the portfolio, including deductions and reimbursements. TPM is event-level; TSM is portfolio-level, and the two work best when the execution data from each promotion flows back into how the budget is managed.
Can trade spend deductions be disputed without proof the promotion ran? They can be challenged, but they are difficult to resolve without evidence. Deductions are claimed by retailers weeks or months after an event, and validating them means matching the claim to what was actually agreed and delivered. Time-stamped shelf images that tie a deduction to a verified display or price change turn a disputed claim into a documented one, which protects spend that would otherwise be written off.
What is the best way to reduce wasted trade spend? The most reliable lever is closing the gap between funded and executed: confirming, store by store, that the price, display, and availability a promotion paid for were actually live during the window. Waste concentrates in the promotions that were funded but only partially executed, and those are invisible until execution is measured directly rather than assumed.
Where This Leaves Trade Spend Leaders
The brands pulling ahead on trade are not the ones with the most detailed plans or the most elaborate settlement reports. Those have been table stakes for years. The advantage now belongs to the teams that can prove what their plans turned into at the shelf – that can stand behind every ROI figure because the execution underneath it was measured, not assumed.
Trade spend will remain the second-largest line on the P&L, and the pressure to defend its return will only grow. The open question for every commercial team is no longer whether the plan was good. It is whether anyone can prove the plan happened. Once a brand can answer that with evidence, optimisation stops being guesswork – and the second-largest line on the P&L finally becomes one the business can actually steer.
Further Reading
- Revenue Growth Management for CPG: What It Is and How Shelf Data Powers It
- Trade Promotion Optimization for CPG Success
- Planogram Compliance in Retail
- On-Shelf Availability and Its Business Impact
- The Complete Guide to Retail Execution and Monitoring
5. FAQs
(Formatted for FAQ schema / AI Overviews - each answer is self-contained.)
What is trade spend management?
Trade spend management is the process CPG manufacturers use to plan, fund, track, and analyze the money they pay retailers and distributors to promote their products, including promotional discounts, slotting and listing fees, display allowances, and rebates. Its purpose is to direct every trade dollar toward profitable incremental sales and account for that spend accurately across the P&L.
What is trade spend?
Trade spend is the money a CPG manufacturer pays retailers and distributors to stock, discount, display, and promote its products, usually measured as a percentage of sales. It spans promotional price reductions, slotting and listing fees, display allowances, and rebates.
How much do CPG companies spend on trade?
Trade spend typically accounts for 15–25% of a CPG manufacturer's gross sales, though the exact share varies by category, channel, and competitive intensity. For many brands it is the single largest cost after the cost of goods.
What is the difference between working and non-working trade spend?
Working trade spend funds activity a shopper can see and act on, such as a promotional price cut or an in-store display. Non-working trade spend covers costs that do not directly drive purchase, such as administrative fees, slotting charges, and deductions for damages or spoilage. Working spend only works if the promotion is actually executed at the shelf.
How is trade spend ROI calculated?
Trade spend ROI is calculated as incremental sales generated by a promotion divided by the trade spend that funded it, usually expressed as a ratio or a percentage. Incremental sales are the lift above the baseline the product would have sold without the promotion, so an accurate baseline and proof the promotion ran are essential.
How do you calculate trade spend as a percentage of sales?
Trade spend as a percentage of sales is total trade spend divided by net sales, multiplied by 100. A complete figure captures every cost tied to the promotion – off-invoice discounts, scan-downs, display allowances, and broker commissions – not just the headline price reduction.
What is the difference between trade promotion management and trade spend management?
Trade promotion management (TPM) plans, executes, and tracks individual promotional events. Trade spend management (TSM) governs the whole financial envelope – budgeting, controlling, and analysing every trade dollar across the portfolio, including deductions and reimbursements. TPM is event-level; TSM is portfolio-level.
Can trade spend deductions be disputed without proof the promotion ran?
They can be challenged, but they are difficult to resolve without evidence. Time-stamped shelf images that tie a deduction to a verified display or price change turn a disputed claim into a documented one, protecting spend that would otherwise be written off.
What is the best way to reduce wasted trade spend?
The most reliable lever is closing the gap between funded and executed: confirming, store by store, that the price, display, and availability a promotion paid for were actually live during the window. Waste concentrates in promotions that were funded but only partially executed.
.png)
.png)
.png)