Share it with your network.


Demand Sensing vs. Demand Planning in CPG: Where Shelf-Truth Data Fits In
Table of Contents
- 1. Demand Planning: The Statistical Baseline
- 2. Demand Sensing: The Fast, Signal-Driven Layer
- 3. Demand Sensing vs. Demand Planning: Side by Side
- 4. The Signal Category Most Demand Sensing Tools Are Missing
- 5. Shelf-Truth Data Isn't a Replacement – It's an Input
- 6. Where Shelf-Truth Data Fits Into Demand Sensing
- 7. Frequently Asked Questions
Most CPG supply chain teams use “demand planning” and “demand sensing” almost interchangeably, and most demand-sensing tools are still built on an incomplete picture of demand. Demand planning is the statistical discipline: historical sales data, time-series models, a forecast built weeks or months out. Demand sensing is the fast layer built on top of it – near-real-time signals that adjust the forecast as conditions change day to day. The distinction itself is well understood. What’s less understood is that demand sensing in CPG is only as accurate as the signals feeding it, and the signal category most sensing tools never touch is what’s actually happening at the shelf.
Key Takeaways
- Demand planning forecasts from historical, statistical data over a long horizon (weeks to months) – built for production, inventory, and budget decisions that need lead time.
- Demand sensing reacts to near-real-time signals over a short horizon (days) – built to catch demand shifts a statistical forecast can’t see coming.
- Demand sensing tools are only as accurate as their inputs, and most run on POS, order, and external data (weather, social, macro trends) – none of which show what’s happening at the shelf.
- A sales dip can mean three different things – real demand softening, a stockout, or lost shelf space – and none of the data most sensing tools read can tell them apart.
- Worse, the signal can actively mislead: when shoppers hit an empty shelf and switch brands, the brand’s sales fall while a competitor’s rise, which looks identical to a genuine shift in consumer preference.
- Shelf-truth data (on-shelf availability, share of shelf, pricing accuracy) is the signal category that closes this gap – not a replacement for demand sensing, an input to it.
- CPG demand forecasting works best as a layered system: statistical planning for the long view, signal-driven sensing for the near view, and shelf-truth data confirming what the sensing layer is actually seeing.
Demand Planning: The Statistical Baseline
Demand planning is the forecasting layer CPG brands have run on for decades. It works from historical sales data, syndicated market data, and time-series statistical models – moving averages, exponential smoothing, seasonal decomposition – to project demand weeks or months into the future. The horizon is long by design: demand planning exists to inform production schedules, inventory targets, and trade budgets, decisions that need lead time, not day-of reaction.
The tradeoff is built into the method. A statistical forecast is only as good as the history it’s trained on, and history doesn’t account for what changed last week – a competitor’s promotion, a weather event, a viral moment, or a stockout that quietly suppressed sales for three days and biased next month’s baseline downward. Demand planning isn’t wrong to run this way; it’s answering a different question than the one demand sensing is built to answer. For a deeper look at how CPG brands structure this layer – the methods, the models, and the best practices around it – see Predictive Demand Planning for CPG Brands: Methods and Best Practices.
Demand Sensing: The Fast, Signal-Driven Layer
Demand sensing is the short-horizon counterpart to demand planning: it reads near-real-time signals – daily or weekly POS data, order patterns, external factors like weather and local events – and adjusts the forecast within days rather than waiting for the next planning cycle. Where demand planning asks “what does history predict,” demand sensing asks “what is happening right now that history couldn’t have predicted.”
This is where CPG demand forecasting has genuinely improved over the last decade. Brands that once relied solely on shipment data or DC-reorder patterns have moved toward daily POS as a closer proxy for actual consumer demand, catching demand shifts days or weeks before a purely statistical model would surface them. The improvement is real, and it matters – a sensing layer that catches a regional demand spike or a category-wide slowdown a week early can meaningfully change replenishment and production decisions. But the accuracy of that improvement depends entirely on what the sensing model is reading. POS data tells you a transaction happened, or didn’t. It doesn’t tell you why.
Demand Sensing vs. Demand Planning: Side by Side
The two disciplines aren’t competing methods – they’re built for different jobs, and most mature CPG forecasting stacks run both.
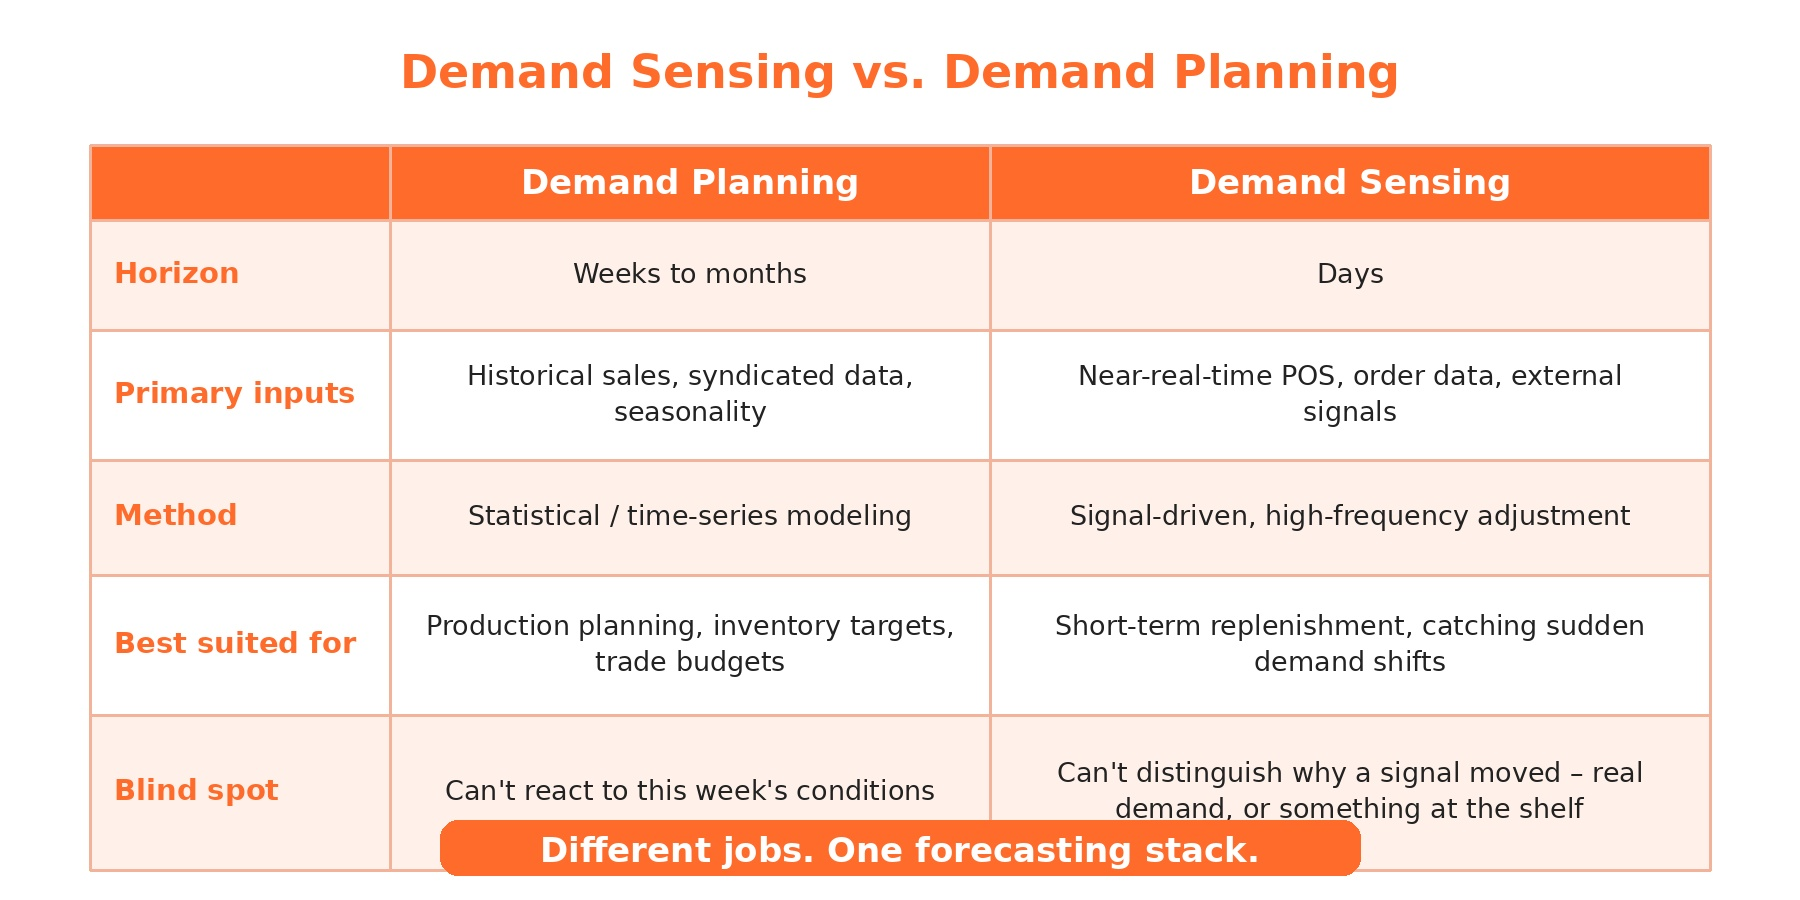
That last row is the one this piece is actually about. A statistical forecast’s blind spot is well documented and generally accepted – it’s the tradeoff for stability. Demand sensing’s blind spot gets far less attention, mostly because the tools built to solve it were never designed to look at the shelf in the first place.
The Signal Category Most Demand Sensing Tools Are Missing
Picture a SKU whose sales drop 25% in a single week. A demand-sensing model built on POS and order data will flag the drop immediately – that’s exactly what it’s designed to do. What it can’t tell you is why. The drop could mean real demand softened. It could also mean the product was simply out of stock for part of that week: NielsenIQ data reported in 2022 found CPG retailers lost 7.4% of sales, roughly $82 billion, to stockouts in 2021 alone – a scale of impact that goes into the same sales data a sensing model reads, indistinguishable from a real demand drop. It could mean the SKU was showing as in stock in the retailer’s system while the shelf sat empty, the phantom inventory scenario. It could just as easily mean the facing was cut in half during a planogram reset, or a competitor picked up the secondary display space the brand used to hold. To a model reading only transaction data, every one of those scenarios produces the same flat or falling line.
This isn’t a flaw unique to any one vendor’s algorithm – it’s a structural gap in the inputs. Demand-sensing tools are typically built on POS, order, and shipment data, supplemented with external signals like weather, social sentiment, or macroeconomic indicators. None of those data streams originate at the shelf. None of them can confirm whether the product was actually available, correctly faced, priced as intended, or holding the shelf space it’s supposed to hold at the moment a sale did or didn’t happen. The model can sense that something changed. It has no way of confirming what actually happened in the store.
The harder problem is that the signal isn’t only incomplete – it can point in the wrong direction entirely. Out-of-stocks run at roughly 8% of SKUs across FMCG retail, according to Gruen and Corsten’s out-of-stock research for the industry, and their consumer data shows what shoppers do when they hit one: 26% buy a different brand on the spot, and another 31% leave to buy it somewhere else. Both behaviours land in the data a demand-sensing model reads. The brand’s SKU shows a decline while a competitor’s shows a lift, in the same store, in the same week – the exact signature of a genuine shift in consumer preference. A sensing model has no reason to read it as anything else, and the correction it recommends is to plan down a product that was selling perfectly well every hour it was actually on the shelf.
That confirmation is what shelf-truth data provides: on-shelf availability (was the product physically there to be bought), share of shelf (did the brand’s shelf presence change relative to competitors), and pricing accuracy (was it priced the way the plan intended). None of these show up in POS or order feeds, because none of them are transactions – they’re the conditions that determine whether a transaction could happen at all. A sensing model that has this signal can tell the difference between “demand fell” and “the product wasn’t there to be bought.” A model without it is guessing.
Shelf-Truth Data Isn't a Replacement – It's an Input
None of this is an argument that demand-sensing tools are doing their job poorly, or that CPG demand forecasting needs a different methodology. The sensing layer is doing exactly what it’s built to do: reading fast-moving signals and adjusting a forecast in near-real time. The gap isn’t in the modeling – it’s in the fact that shelf-level execution data has rarely been treated as a signal category at all, alongside POS, weather, and social data.
ParallelDots’ role in this picture is the shelf signal itself, not the sensing model that consumes it – and that distinction shapes how the data is meant to be used. Shelf-truth data is additive to whatever forecasting stack a brand already runs, in-house or vendor-supplied. It doesn’t compete with the statistical rigour of demand planning or the responsiveness of demand sensing. It gives both a way to confirm whether a shift in the numbers reflects real demand or a shelf-execution issue that has nothing to do with what shoppers actually want.
Where Shelf-Truth Data Fits Into Demand Sensing
Feeding a demand-sensing system shelf-truth data means giving it visibility into three things a transaction feed can’t show: whether the product was on shelf and available, how much shelf space and secondary display it held relative to competitors, and whether it was priced the way the plan intended. The reason this has to be captured at the shelf rather than inferred upstream is that the shelf is where most of the problem originates – Gruen and Corsten attribute roughly 72% of out-of-stocks to store-level causes, with about 25% coming down to shelf-level issues even when the stock is physically in the building. ShelfWatch captures these conditions directly from store-level image data, turning what used to be an invisible variable in demand forecasting into a signal an existing sensing or planning system can actually use.
In practice, this closes the exact gap described above. When a SKU’s sales dip, on-shelf availability data confirms or rules out a stockout as the cause – the same failure mode behind the stockout losses cited earlier. Share-of-shelf tracking shows whether the brand lost facings or secondary display space to a competitor around the same time – see Share of Shelf: Why It Matters and How to Measure It for how that measurement works. Pricing compliance data confirms whether the product was actually sold at the price the forecast assumed, closing a gap that promotion and pricing compliance programs are built to catch. And for teams that want the fuller picture of how out-of-stocks alone affect the top line before layering in sensing, Understanding OOS in Retail and Its Impact on Store Sales covers that ground in depth.
Return to the SKU that dropped 25%. With shelf-truth data alongside the sensing signal, that week reads very differently. On-shelf availability shows the SKU was absent from 40% of stores in the affected region for four days, share of shelf shows the brand held its facings everywhere it was in stock, and pricing data confirms the promotional price was live as planned. The demand signal was never the story – the execution was. The planner’s action changes from cutting the forecast to escalating replenishment in a specific set of stores, and the baseline for next quarter stays intact instead of absorbing a dip that consumer demand never caused.
That is the practical difference shelf-truth data makes: it turns an ambiguous number into a decision a team can act on with confidence. It means adding a signal category that has been sitting at the shelf all along, just never captured or fed back into the models making these calls. To see how ShelfWatch delivers on-shelf availability, share-of-shelf, and pricing data into a brand’s existing forecasting stack, request a demo.
Demand planning tells a CPG brand what history says to expect. Demand sensing tells it what’s happening right now. But “right now” is only as complete as the data behind it – and for most demand sensing in CPG today, that data stops at the transaction and never reaches the shelf. Closing that gap isn’t about building a better forecasting model; it’s about giving the model a signal it’s never had.
Frequently Asked Questions
What is the difference between demand sensing and demand planning in CPG?
Demand planning uses historical sales data and statistical models to forecast demand weeks or months ahead, while demand sensing uses near-real-time signals like daily POS data to adjust that forecast within days. Most CPG forecasting stacks use both together, not one instead of the other.
What data does demand sensing typically use in CPG?
Demand-sensing tools generally read near-real-time POS data, order patterns, shipment data, and external signals such as weather, local events, or social trends. They typically don’t include shelf-level execution data like on-shelf availability, share of shelf, or pricing accuracy.
Is demand sensing replacing demand planning?
No. Demand sensing and demand planning solve different problems – one is a long-horizon statistical forecast, the other a short-horizon, signal-driven adjustment. Most CPG brands run both, using demand sensing to catch short-term shifts a statistical forecast can’t anticipate.
Can a stockout look like a demand drop in a demand-sensing model?
Yes. A demand-sensing model reading POS or order data sees a flat or falling sales line whether the cause is a genuine drop in demand, a stockout, or lost shelf space – the transaction data looks the same in all three cases. Shelf-level data is what distinguishes the cause.
What is shelf-truth data in CPG demand forecasting?
Shelf-truth data refers to store-level information – on-shelf availability, share of shelf, and pricing accuracy – captured directly from the shelf rather than inferred from transactions. It confirms whether a product was actually available, visible, and priced as intended at the moment a sale did or didn’t happen.
Why can stockouts make a demand forecast worse over time?
When a product is unavailable, shoppers switch: research by Gruen and Corsten found 26% buy a different brand and 31% buy elsewhere. The brand’s sales fall while a competitor’s rise, so the forecast reads it as a real loss of consumer preference and plans the product down – even though it sold normally whenever it was on the shelf.
Do CPG brands need shelf-truth data if they already use demand sensing?
Shelf-truth data doesn’t replace a demand-sensing system – it feeds it a signal category the sensing model doesn’t otherwise have, helping distinguish a real demand shift from a shelf-execution issue like a stockout or a lost facing.
.png)
.png)
.png)