Share it with your network.
Your weekly compliance report says 91%. Your quarterly review surfaces a gap nobody can immediately explain. Those two numbers are measuring different things – and the space between them is where most shelf execution value gets lost.
Digital shelf monitoring – the practice of capturing and analysing physical store shelf conditions through AI-powered image recognition to produce structured execution data in real time – is how category teams close that gap. Not by adding another reporting layer, but by changing what gets measured and when.
This guide covers what digital shelf analytics actually tracks, where measurement breaks down at scale, and what it takes to move from shelf data you report from to shelf data you act on.
Key Takeaways
- Content drift is the most underdiagnosed execution failure: Retailer algorithms and field rep variance degrade planogram compliance without triggering a single alert in standard reporting.
- Phantom inventory is the compliance problem most reports cannot see: An SKU can be listed as in-stock, counted as compliant, and physically absent from the shelf simultaneously.
- Digital shelf performance data and sales reports are measuring different points in time: Compliance scores tell you what the shelf shows today; sales data tells you what it showed last period.
- Monitoring without defined action thresholds produces noise, not intelligence: An alert without a clear escalation path generates concern but not a corrected shelf.
- Monthly compliance checks are not measuring the shelf they think they are: Conditions can degrade and partially recover within a single week.
Why On-Shelf Availability Failures Hide in Plain Sight
On-shelf availability has a definition most practitioners know and a measurement problem most compliance frameworks underestimate.
On-shelf availability (OSA) is the condition in which a product is physically present on the correct fixture, in sufficient facings, and purchasable by a shopper without staff assistance. That definition sounds straightforward. The measurement problem is that OSA failures come in forms that inventory records and manual audit checklists consistently miss – and the gap between what systems report and what shelves actually show is where a significant share of lost sales originates.
The most prevalent failure mode is phantom inventory: a SKU listed as in-stock in the system, allocated its planogram position, counted as compliant in the weekly report – but physically absent or near-depleted on the actual fixture. No alert fires. The field rep who visited two days ago recorded it as available. The shopper who visits today sees a gap. The report still reads compliant.
The other failure modes are structurally similar. Wrong-position placement means a product is in the store but not where shoppers expect it – the wrong shelf level, adjacent category, or behind a secondary promotional display; no system registers it as unavailable, and no replenishment trigger fires. Facing erosion means facings have collapsed to one or two units – the product is technically present and inventory counts are technically healthy, but the brand has effectively zero shelf presence. Post-reset drift happens when a category reset executes correctly but competitive products begin creeping into adjacent space within days; the next formal audit is three weeks away.
There is a layer most compliance frameworks miss entirely: field team turnover. A rep who has covered a territory for three years has a calibrated, consistent read of what compliant looks like. A rep in their third week applies a different standard. Across 200 field reps, that variance does not average out - it becomes structural noise in the compliance data. Scores that look stable quarter-on-quarter may reflect consistent measurement inconsistency rather than consistent execution.
Out-of-stock events in physical retail cost CPG brands an estimated $1 trillion in lost sales annually. A significant share traces to execution failures, not supply chain failures. The product is in the building. The shelf tells a different story.

The Digital Shelf Data That Drives Corrective Action – Not Just Reporting
The difference between manual shelf measurement and digital shelf analytics is not speed. It is the quality and completeness of what gets measured – and what does not get lost between the store and the spreadsheet.
When a field rep photographs a shelf and that image is processed through computer vision – AI models trained on millions of retail shelf photographs that automatically identify SKUs, count facings, and measure compliance against an approved planogram – the output is fifteen to twenty structured data points from a single image: SKU presence, facing count, planogram compliance status, share of shelf, competitor activity, and promotional display execution. Extracted automatically before the rep moves to the next store. The category manager does not wait for end-of-week consolidation. The finding surfaces when it is still actionable.
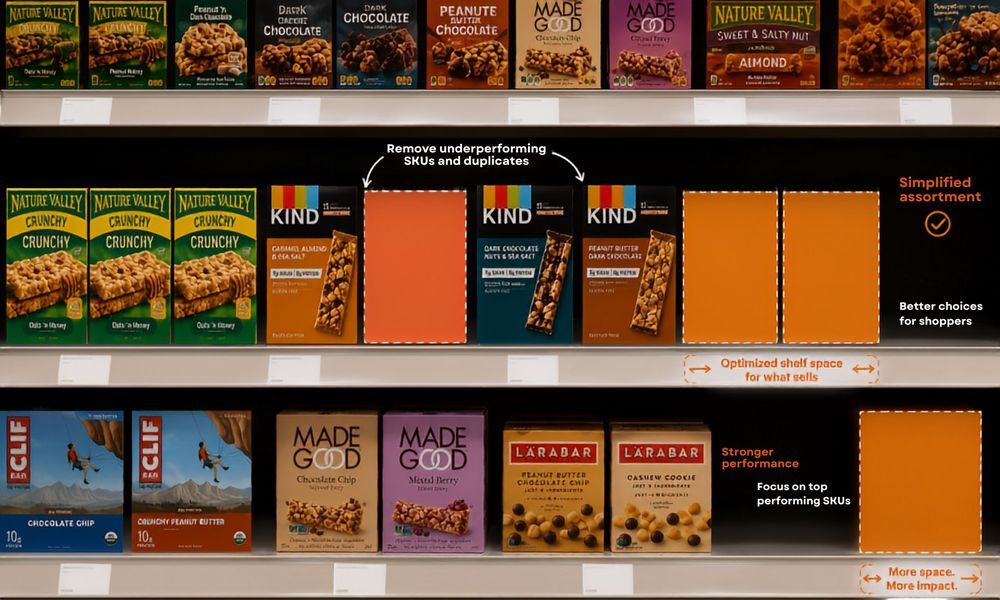
Three data categories drive most corrective action in practice. Planogram compliance at the SKU level tells you whether each individual product is in its designated position with the correct facing count right now - not a category-level percentage. A deviation on a high-velocity SKU during a promotional window is a different priority to the same deviation on a slow-moving SKU at a secondary retailer. That distinction requires SKU-level granularity; an aggregated compliance score buries it.
Share of shelf measured against actual competitor presence is a different measurement from what manual audits produce. Manual audits capture a brand’s own facings. Computer vision processes the entire shelf image - share of shelf calculated against what every competing brand actually holds at that moment, not an estimated category total. If a competitor expands two facings across forty stores over three weeks, that trend appears in the data before it surfaces in market share numbers.
On-shelf availability confirmed visually, not inferred from stock records, is the third category - whether the product is physically purchasable on the fixture rather than whether inventory records indicate it should be. ParallelDots’ ShelfWatch provides that visual confirmation at audit frequency, creating a direct link between what field teams capture and what category managers can act on, without the manual consolidation step that introduces both lag and variance.
The honest operational picture at scale: most brands are not managing this from a single system. They are stitching together retail portal exports, distributor data feeds, legacy DMS records, and a category management file someone in regional ops owns informally. Getting that into a form where a same-day decision is possible is the harder problem - and it is the gap that separates a shelf intelligence capability from a shelf reporting capability.

Digital Shelf Management at Scale: Where Execution Friction Actually Lives
Detecting a compliance failure is not the same as correcting it. The gap between those two things – between a shelf problem surfacing and someone with authority acting on it – is where most execution value gets lost.
At ten stores, that gap is a conversation. At 500, it is a workflow problem.
With image-based shelf analytics, findings surface faster than any manual audit could produce them. The issue is what happens after the finding surfaces. An alert that reaches a category manager at HQ without a clear escalation path to the regional manager responsible for those stores - or the field rep who can physically correct the shelf - generates concern but not action.
Effective digital shelf management resolves data at three distinct levels, and the failure mode at each level is different. At the field rep level, the finding needs to reach the rep while they are still in the store or region. Wrong-position placement, facing erosion, and phantom inventory gaps are correctable on the same visit if the rep is aware of them in time - but that requires alerts that are specific, store-level, and SKU-identified, not a consolidated weekly report.
At the regional manager level, the value is pattern recognition across stores. A single store with a planogram deviation is an execution error. The same deviation across twenty stores in a region is a systemic problem – a reset that did not land, a distributor issue, or a competitive incursion that field teams are consistently losing. Regional managers need data that surfaces patterns across their territory, not individual store alerts they were never intended to action personally.
At the category manager level, the data connects shelf execution to category strategy. Which SKUs are consistently underperforming compliance thresholds? Where is competitive encroachment concentrated? Which store formats generate the highest OSA failure rates? These questions are only answerable when the two levels below are already functional – which is why most brands find their shelf analytics investment underperforms: they implement the data layer without building the response structure underneath it.
The messy reality at 1,000 stores: most organisations have resolved this for one of these three levels. Building the workflow infrastructure that makes data actionable at all three simultaneously – with appropriate alert thresholds, ownership assignment, and escalation logic – is the implementation challenge that no platform solves automatically.
Also Read: On-Shelf Availability - Why Products Go Missing at the Shelf →
What Digital Shelf Analytics Tells You That Sales Data Cannot
Sales data is a lagging indicator. It tells you what happened in the period just closed – what shoppers bought, what they did not, which categories grew and which declined. It does not tell you why the shelf underperformed during the second week of a promotional window, or whether the compliance gap that preceded a regional dip has been corrected or is still compounding.
Digital shelf analytics – the structured analysis of shelf image data to measure execution quality, identify failure patterns, and prioritise corrective action across a store network – operates on a different timeline. A planogram deviation flagged on Tuesday morning is still correctable before the weekend traffic peak. The same deviation surfacing in a Friday sales summary has already cost the brand its highest-footfall window.
For high-velocity categories during promotional periods, the sales impact of a three-day execution gap is measurable. The challenge is that most category teams have spent years optimising their response to lagging indicators, because that was the only data available. Shelf analytics introduces a different discipline – acting on leading indicators before they become the numbers in next quarter’s review.
The leading indicators that matter are not visible in a standard sales dashboard: planogram compliance score by SKU and store; share of shelf tracked against competitor presence; and OSA confirmed through image capture rather than inferred from records. Each measures a condition that precedes a revenue outcome. Sales data confirms outcomes. Shelf analytics determines whether those outcomes have already been decided before the reporting period closes.
The brands that build this capability are not doing anything structurally complicated. They are measuring what is actually on the shelf, at the frequency the fixture changes, and connecting that measurement to the people who can act on it. At 1,000 stores, that is an operational commitment. The question worth sitting with is not whether the data is available – it almost certainly is – but whether the organisation is structured to do anything useful with it before the window closes.

.png)